
 Concept stage
Plan shade with data
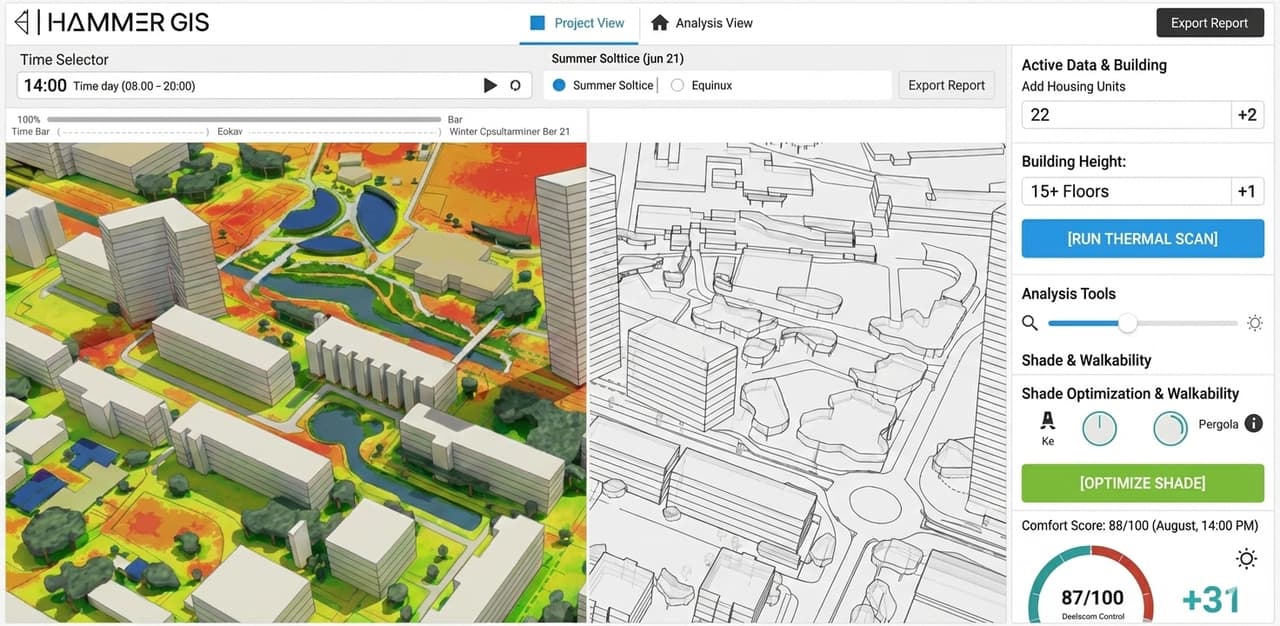
CLIMYX is a product at concept stage: a tool for analysing urban heat islands and outdoor comfort at street level, made for urban planning. It builds on the heat-mapping projects HAMMER already delivers for municipalities, such as the Kiryat Yam pilot, where heat is mapped down to the path, the bus stop and the bench.
CLIMYX: a 3D city switching to a street-level heat map
The problem
Heat isn't a citywide average
A satellite map shows that the city is hot. It doesn't show which bus stop stands in full sun at noon, which path never gets a moment of shade, or where a single tree or canopy would make the biggest difference. Without those answers, a shade plan stays a wish list and the budget spreads thin instead of going where it is needed.
Working today
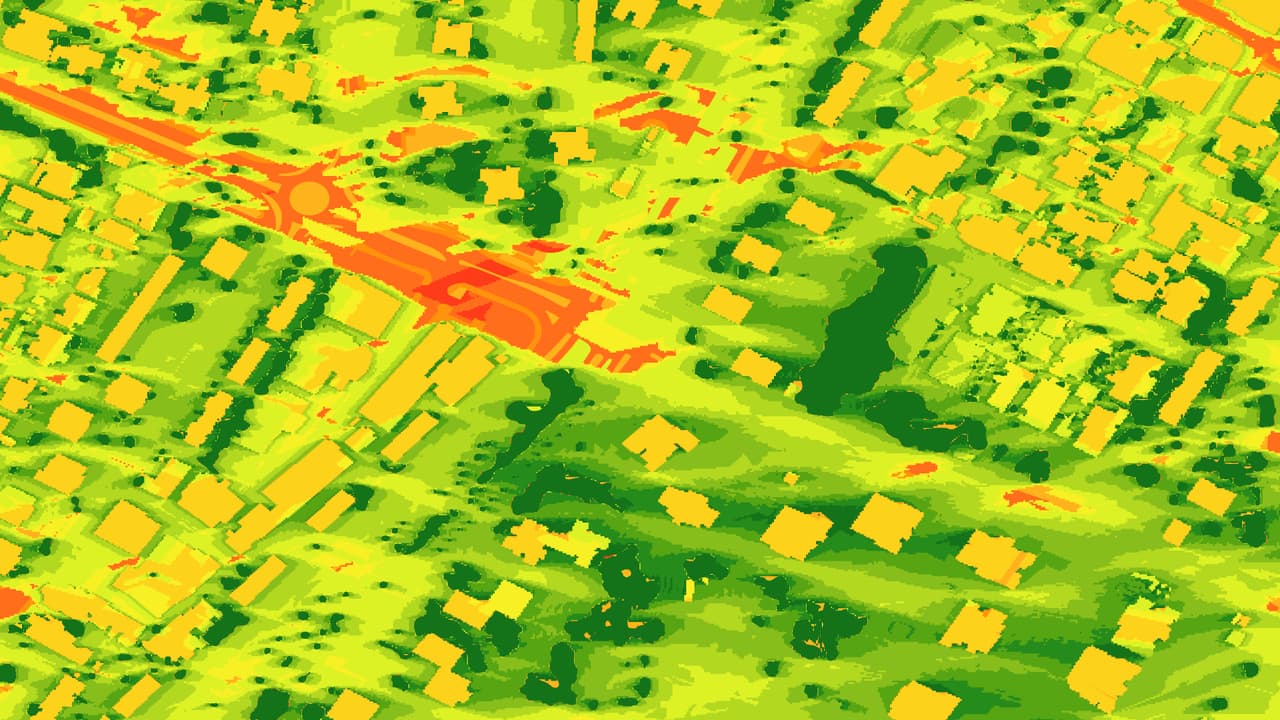
Urban heat mapping as a municipal service
Before there is software, there is a method. HAMMER maps urban heat islands as a project service, and that method is the foundation of CLIMYX.
- Layers from aerial imageryTree canopies and their heights, shade structures and their heights, vegetation, asphalt, pavements and paths, artificial surfaces, buildings and their heights, and open areas.
- Shade through the dayShade is computed every half hour across the day, to show where shade falls and when it disappears.
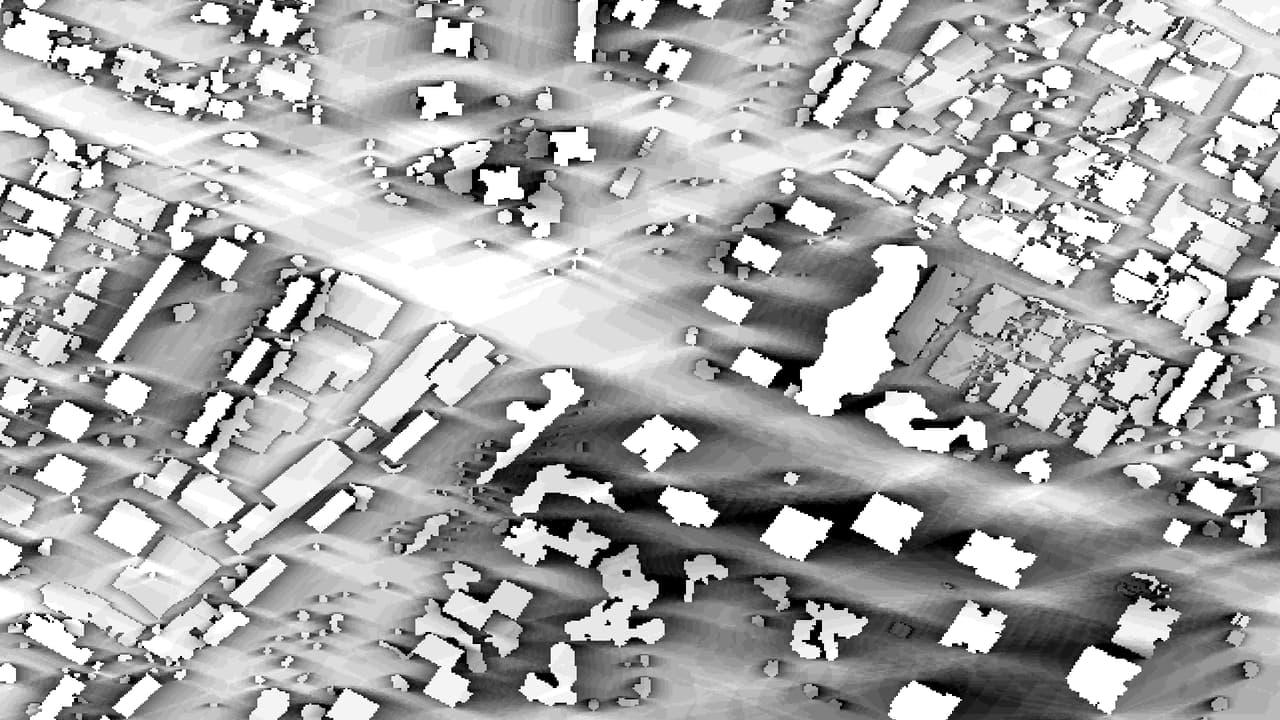
- An integrated heat modelSolar radiation, sun-exposure duration, changing shade and the thermal response of materials such as asphalt, concrete, metal and wood, combined with a 3D surface model (DSM) and remote sensing.
- No street sensorsThe mapping is computed from spatial data, with no sensors to deploy and maintain on the street.
- A shade priority mapA map that shows where shading and planting will help most. Deliverables come as GIS layers and DWG.
The method
From aerial photo to a priority map
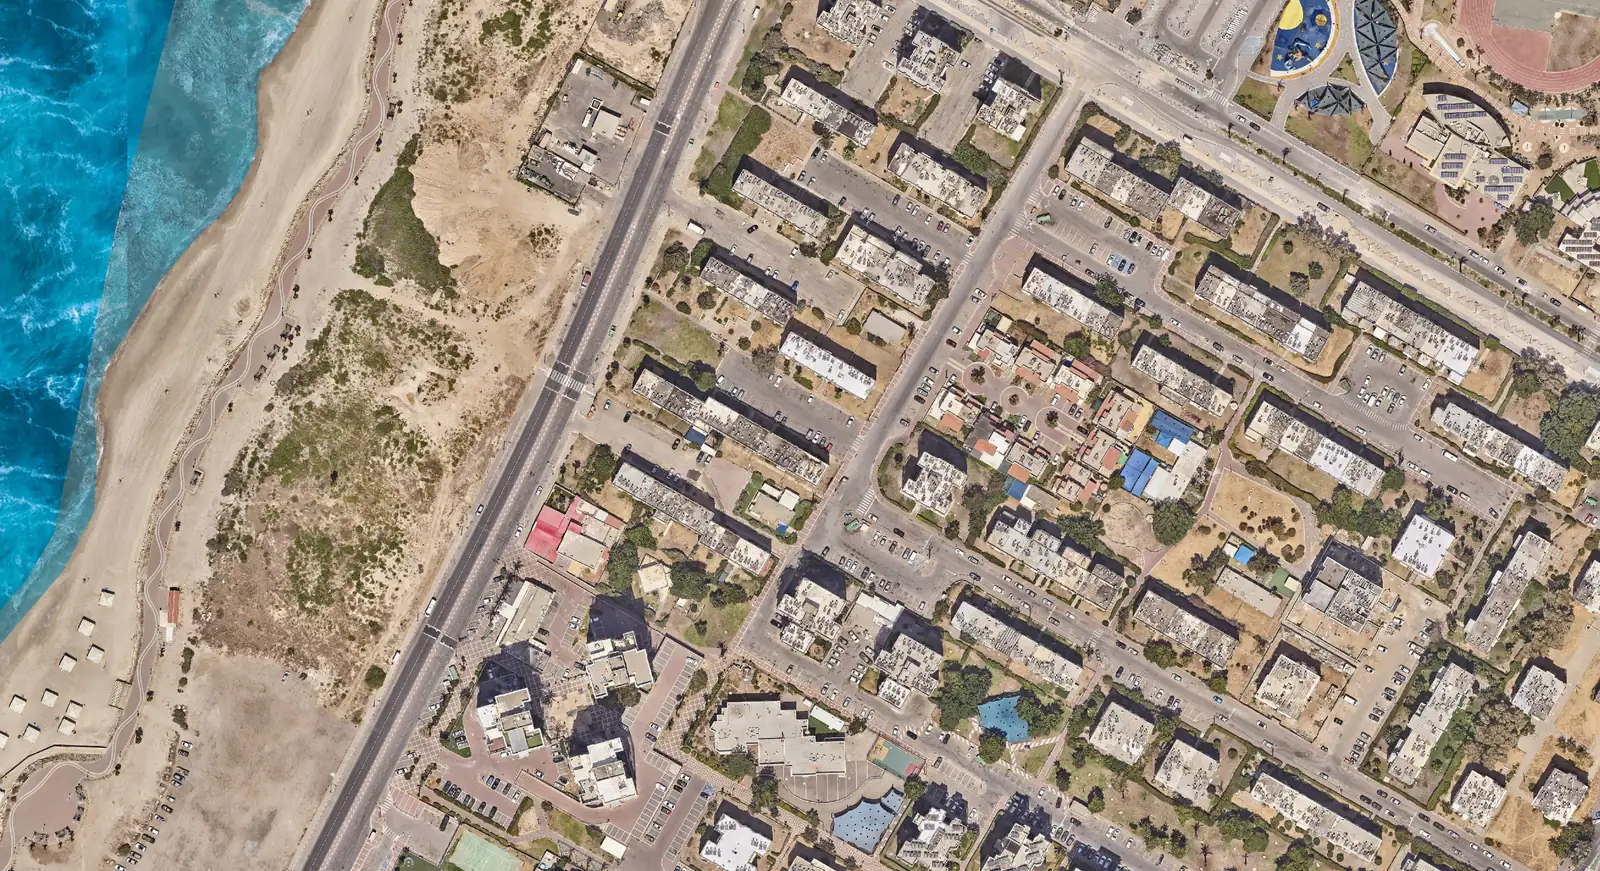
- Imagery and elevation An aerial photo and a 3D surface model.
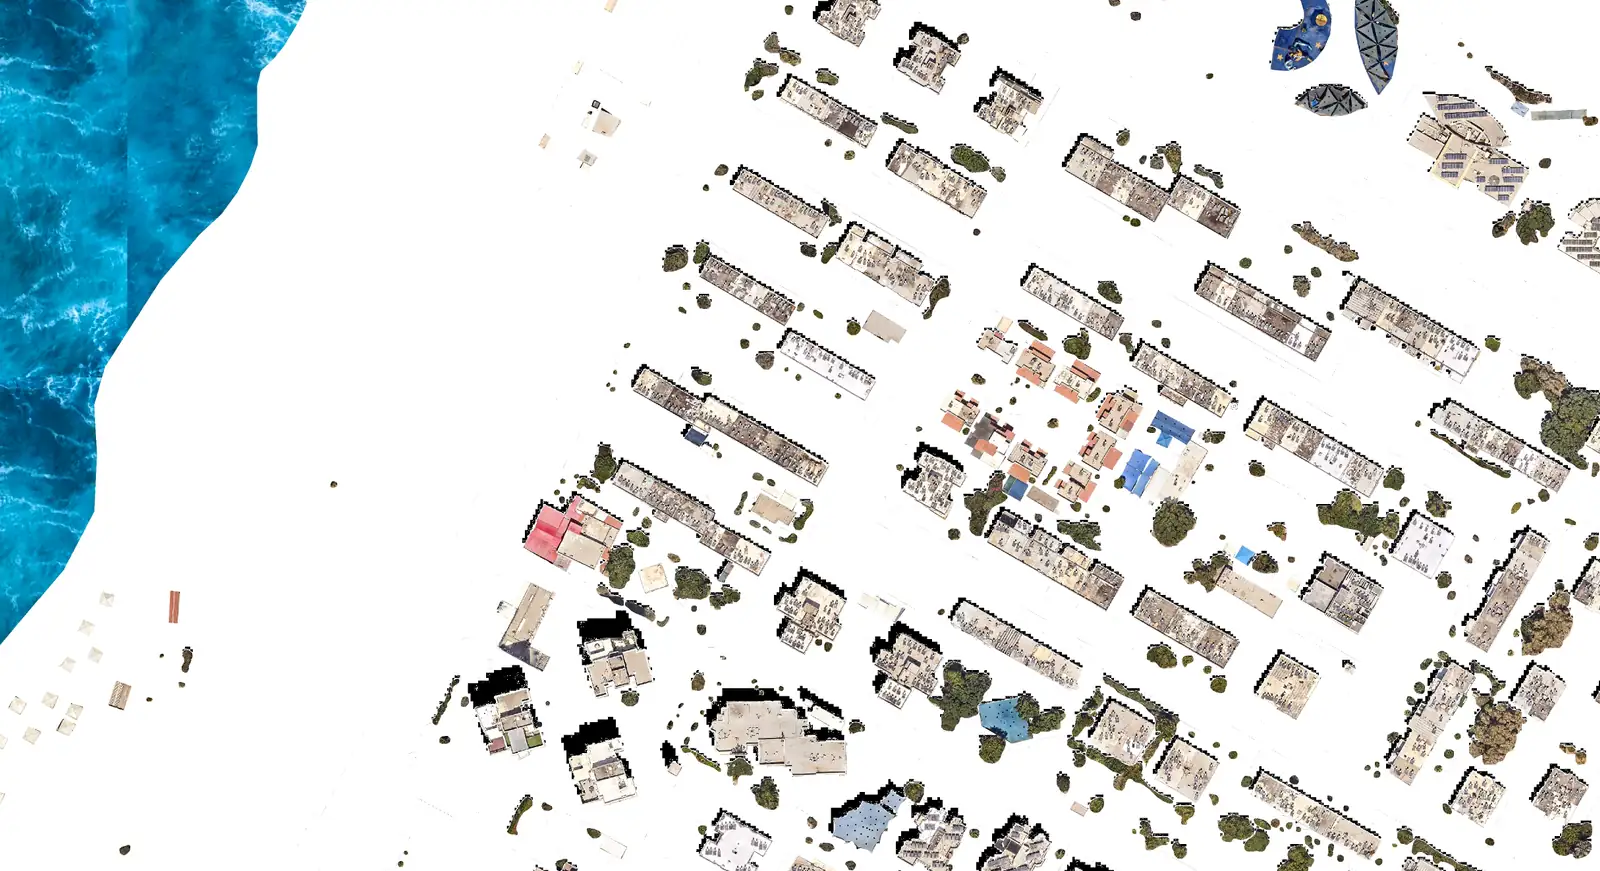
- Layer extraction Trees, shade structures, surface materials and buildings, each with its height.
- Shade through the day Shade computed every half hour.
- Heat model Radiation, exposure, shade and material thermal response combined.
- Priorities A map that shows where to start shading and planting.
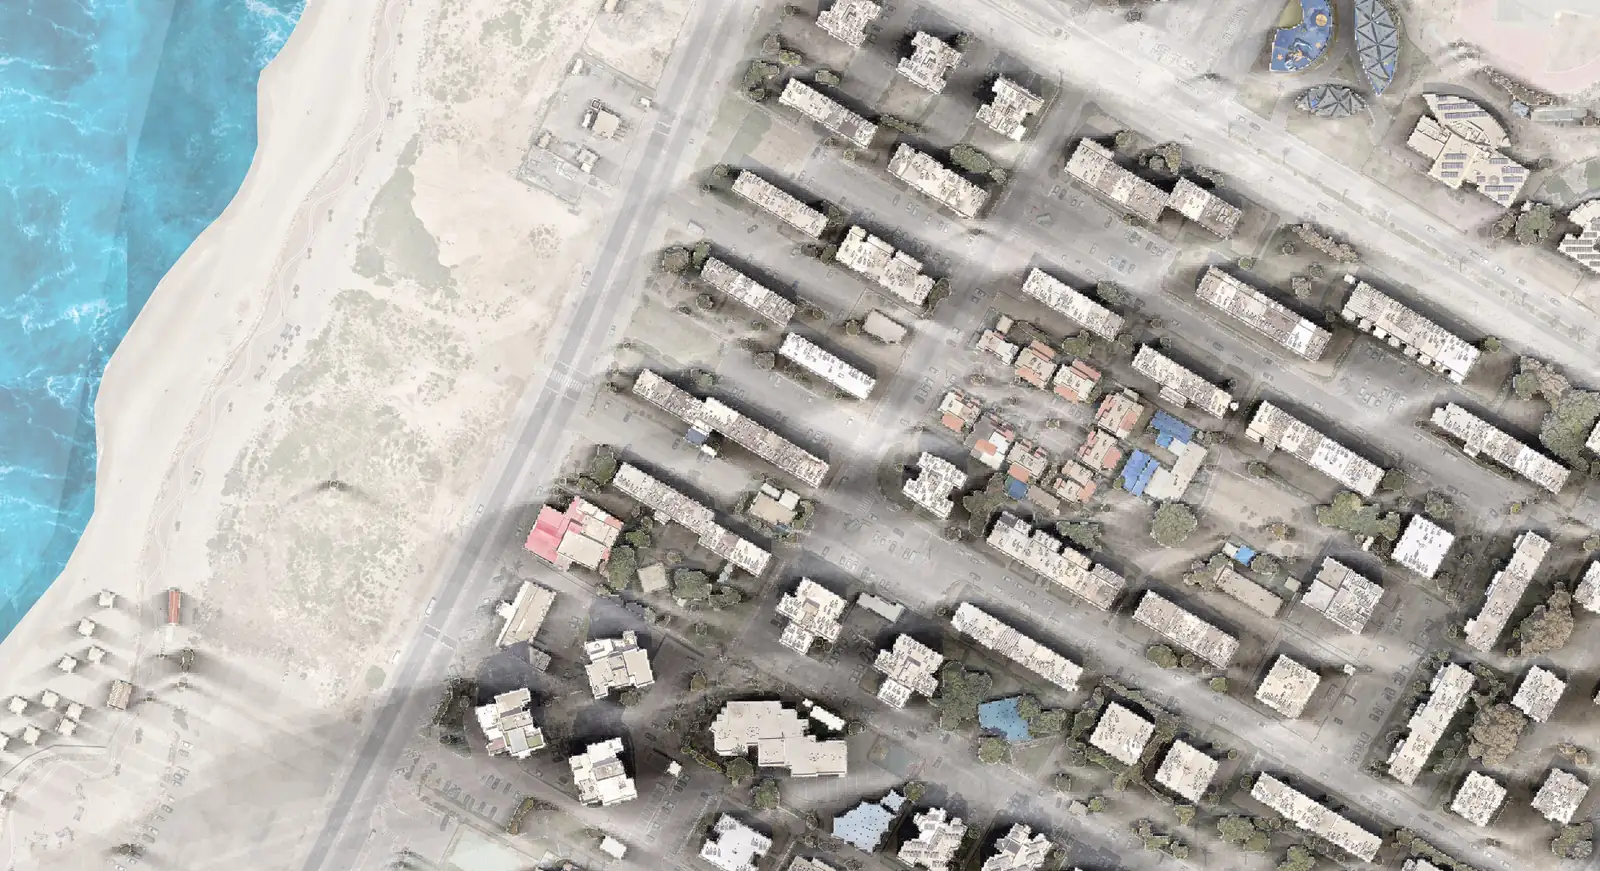
Shade from buildings and trees sweeping across a coastal neighbourhood through the day, ending on a cumulative shade map
From the field
The Kiryat Yam pilot
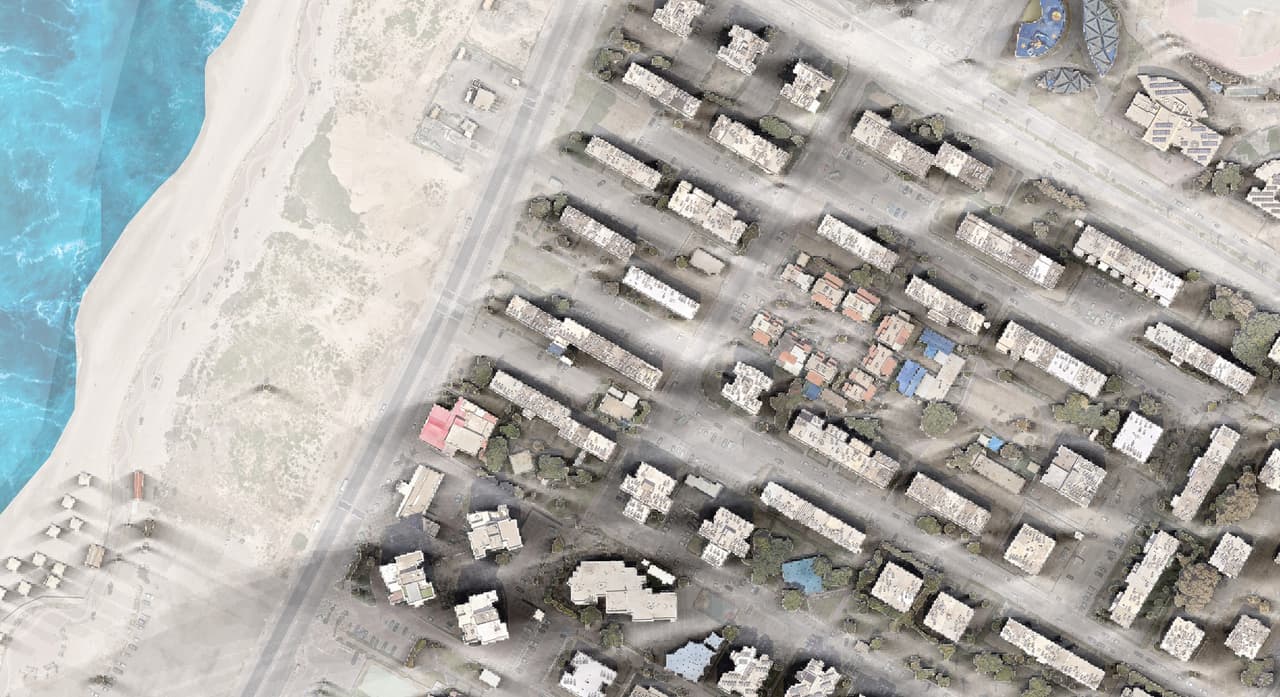
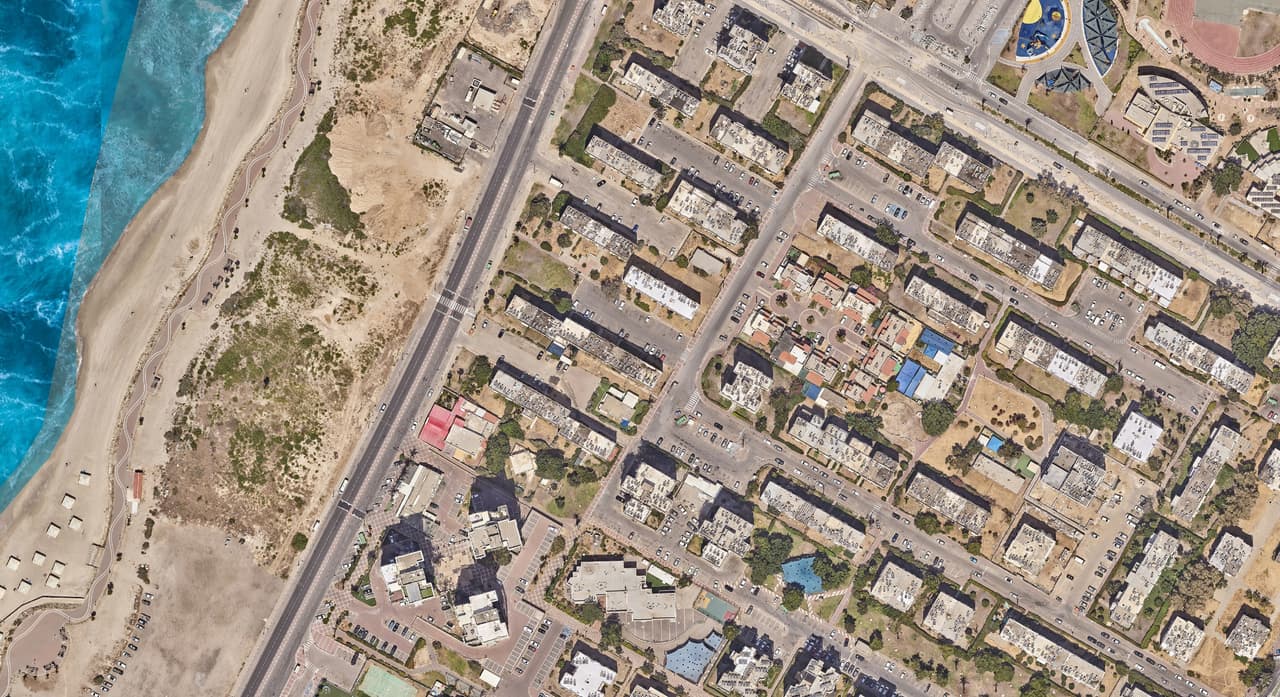
In Kiryat Yam we mapped the heat hotspots across the city's streets and built a map showing where shade and tree planting would have the most effect. That is the work CLIMYX is meant to turn into a standing tool.
Where CLIMYX is heading
A direction, not an off-the-shelf product
These are the directions we are exploring. The final scope is still being set, and nothing on this list is available as software today.
- The city in 3DBuildings and terrain in 3D on a web map.
- Radiation and heat islandsSolar-radiation and heat-island indicators at street level.
- Thermal comfortIndicators such as sky view factor (SVF), mean radiant temperature (MRT) and UTCI.
- Scenario comparisonTesting design alternatives against each other before money goes into construction.
Who it's for
For whoever decides where the shade goes
- Urban plannersSpatial evidence of where the street is hot and where an intervention will matter most.
- Climate and sustainability teamsA data foundation for a shade plan and for climate adaptation.
- Authorities that want to start nowThe heat-mapping service is available today, no need to wait for the software.
Deliverables
What a heat-mapping project delivers
- GIS layersTrees, shade structures, surface materials and buildings with heights
- DWGThe same layers for design work
- Priority mapWhere to shade and plant first
Status
Concept stage
CLIMYX is not available yet: there is no customer release and no customers for the product. What is available today is HAMMER's urban heat-mapping service. Municipalities that want a say in where CLIMYX goes are welcome to talk to us.
Frequently asked questions
What is CLIMYX?
CLIMYX is an upcoming HAMMER product for analysing urban heat islands and outdoor comfort at street level, as a tool for urban planning. It is at concept stage and builds on the heat-mapping projects HAMMER delivers to municipalities as a service.
Can we buy CLIMYX today?
No. CLIMYX is not available yet. You can commission an urban heat-mapping project today, based on the same method.
What is an urban heat island, and why should a municipality care?
Part of a city that runs hotter than its surroundings because of asphalt, concrete and a lack of shade and vegetation. Extreme heat hits older people and children hardest and drives people out of public space. Precise mapping lets a municipality put shade and planting where they are needed.
How do you map heat without sensors?
In HAMMER's method the map is computed: layers from aerial imagery, a 3D surface model, shade calculated through the day, and the thermal response of materials such as asphalt, concrete, metal and wood. The result is a street-level map with no sensors to deploy.
What happened in the Kiryat Yam pilot?
We mapped the heat hotspots in the city's streets and built a map showing where shade and tree planting would have the most effect.
How is this different from a satellite heat map?
Satellite heat maps show the city at coarse resolution. HAMMER's method relies on aerial imagery and an elevation model, so it can tell the shaded side of a street from the exposed one, and one bus stop from the next.
Can the output serve as a certified microclimate study?
No. The mapping is a prioritisation and planning tool, not a substitute for a certified microclimate study or an engineering assessment.
Want to know where your city runs hottest?
We'll present the heat-mapping method and the Kiryat Yam pilot, and look at what we can map for you right now.