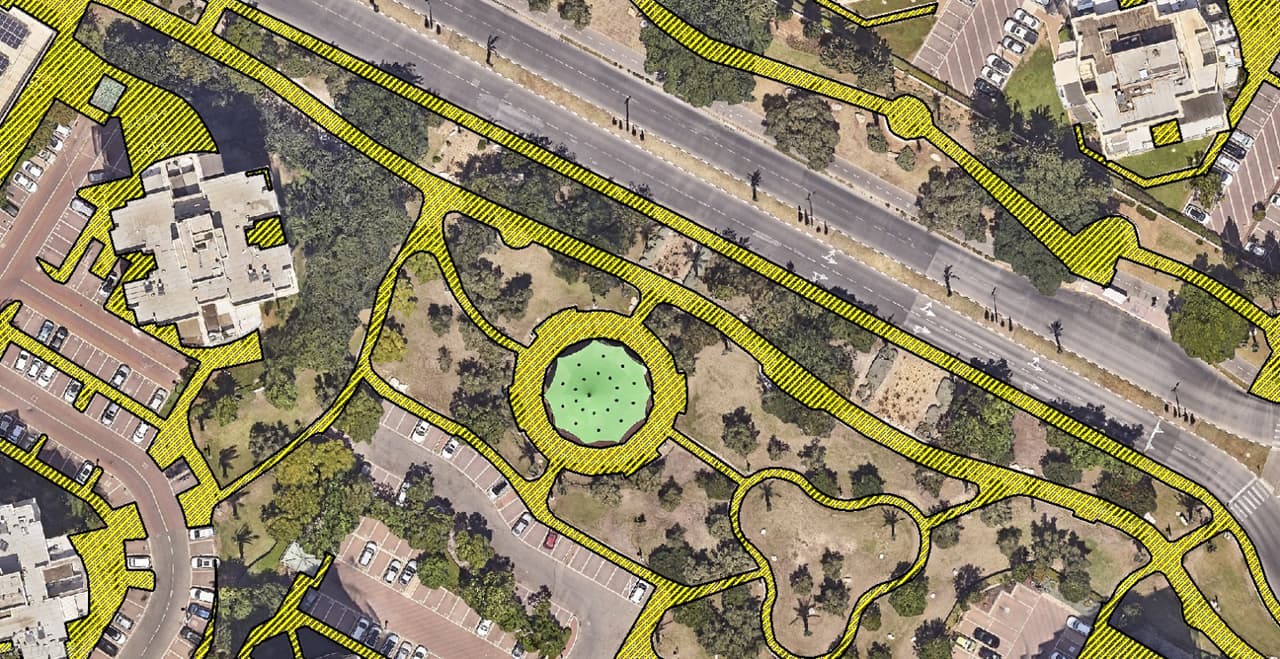
Every tree, every bed, every water meter. On one map.
A tree and green-space survey maps the urban vegetation: trees, canopies, planted areas, shrubs and irrigation meters. The result serves the parks department in planning pruning and irrigation, engineering in planning shade, and the municipality in managing the mature trees in its area.
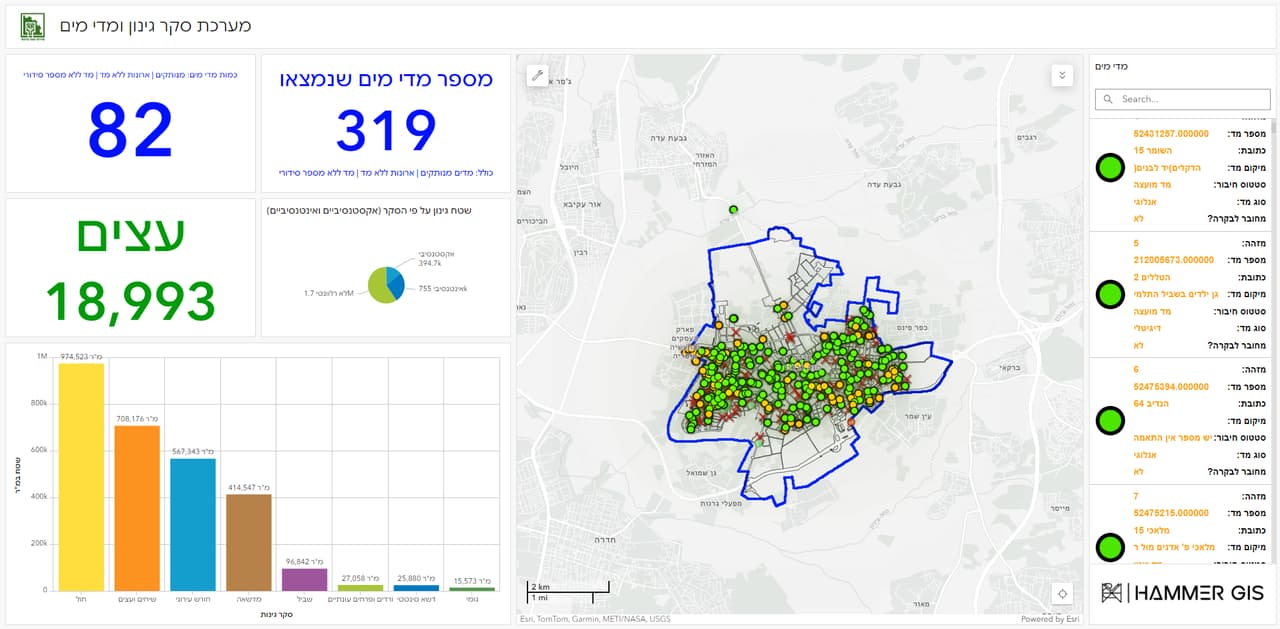
Gardening and water-meter dashboard updatingDASH-02 · ▶ LOOP
CH.01TC 00:01:23:07
What it is
The city's vegetation, managed as an asset
A tree and green-space survey maps every tree, canopy and planted area in the municipality, with attributes and photos, stored as GIS layers the parks department can work with.
Trees are a municipal asset that grows, changes and needs care. Without an inventory, it is hard to plan pruning cycles, estimate water use, choose where to plant or respond to a felling request. The survey gives you a complete map of the vegetation and lets you manage it like any other asset.
Gardening survey dashboard: tree counts and mapDASH-04 · STILL
CH.02TC 00:02:46:14
The layers
What we map
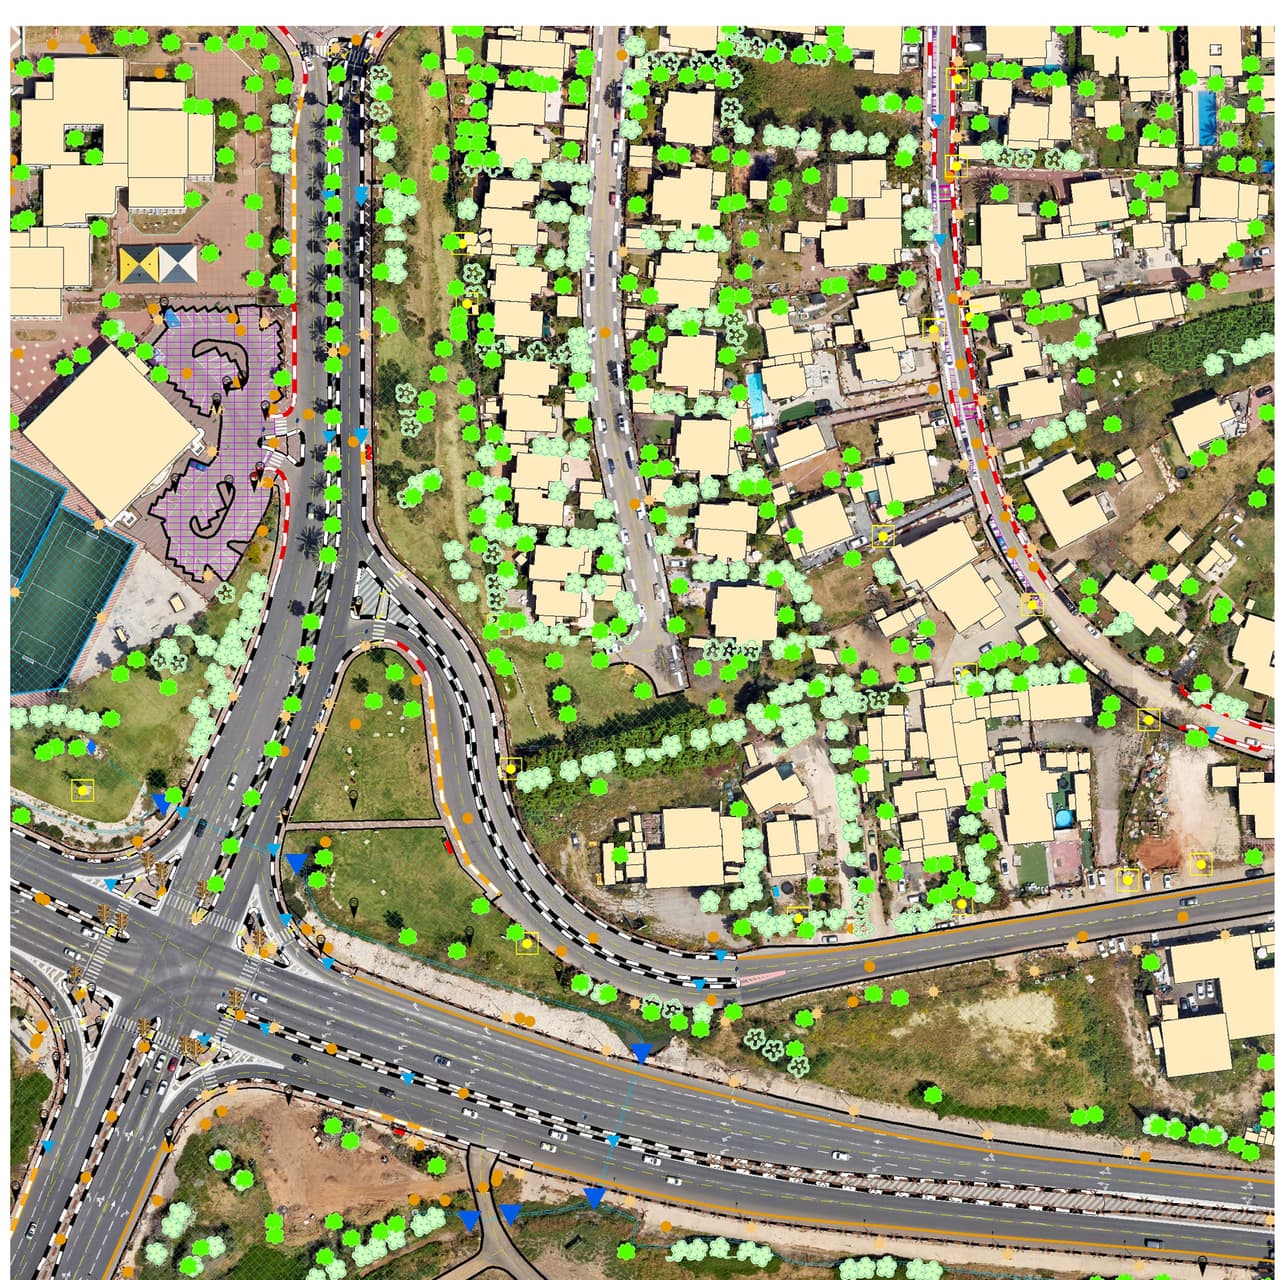
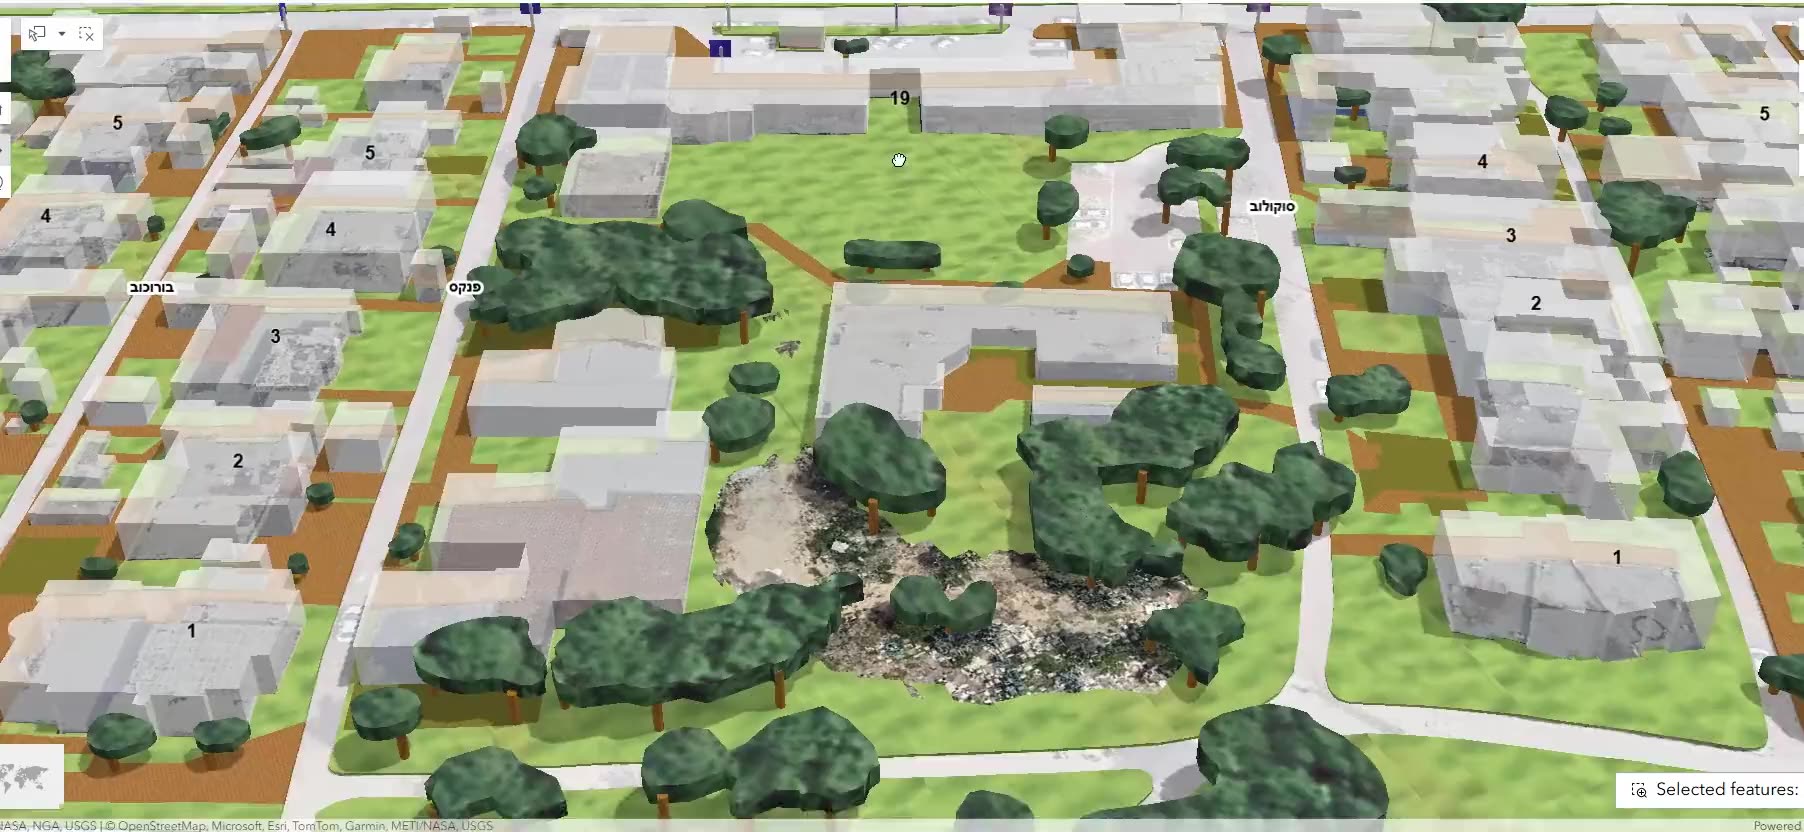
01TreesA point for every tree and its canopy as a polygon, with height from a 3D model where one exists.
02Planted areasGreen areas, beds, lawns, shrubs and hedges, as polygons with type and area.
03Irrigation metersIrrigation water meters and their relation to the areas they serve.
04Attributes to your specSpecies, height, trunk diameter, condition and other fields are agreed with your parks department or arborist.
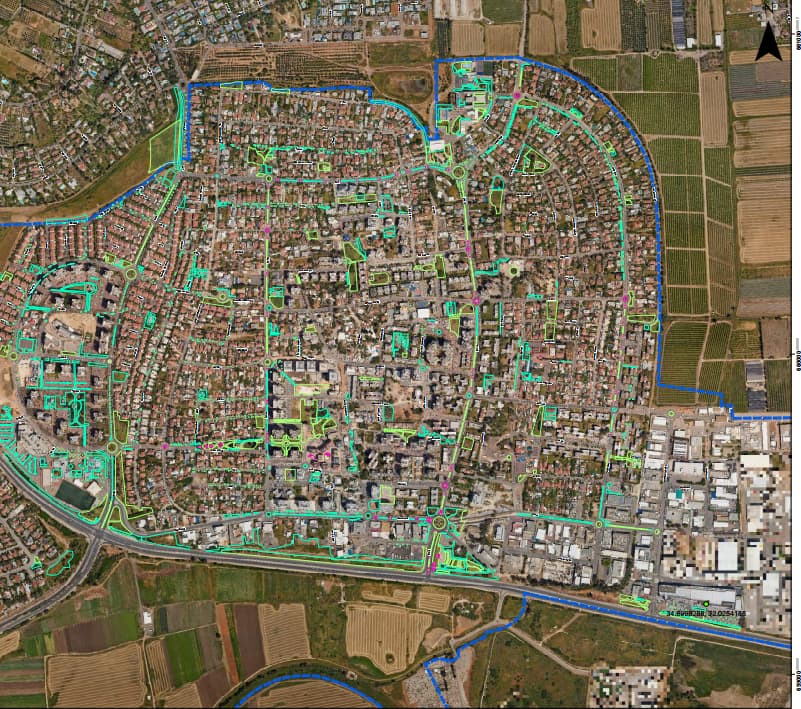
Gardening survey map over the orthophotoORTHO-63 · STILL
CH.03TC 00:04:09:21
How it works
From the air, from the ground, back to the map
TAKE 01 · ST-01DefinitionWe set the survey boundary, the attribute list, and what is captured from the air versus on the ground.
TAKE 02 · ST-02Mapping from the airTree canopies and planted areas are mapped from the orthophoto, with AI detection and an interpreter's review.
TAKE 03 · ST-03On-foot surveyField surveyors with a mobile app record individual trees, water meters and close-up attributes, including a photo.
TAKE 04 · ST-04Quality controlAerial and field results are compared, gaps are filled and attributes checked for consistency.
TAKE 05 · ST-05DeliveryGIS layers, a green-space dashboard with counters, and 2D and 3D views you can navigate from a phone in the field.
CH.04TC 00:05:32:03
Uses
What the inventory is for
Pruning and green wastePruning cycles planned by area, and green-waste collection-day maps for residents.
IrrigationWater meters linked to the areas they irrigate, as a basis for tracking consumption.
Mature treesAn orderly inventory that supports felling and relocation requests handled with the Forestry Officer.
Planting plansFind streets and neighbourhoods with low canopy cover, and plan planting from data.
CH.05TC 00:06:55:10
FAQ
Questions about tree and green-space surveys
What does a tree survey include?
Each tree mapped as a point and its canopy as a polygon, with a photo and pre-agreed attributes such as species, height, trunk diameter and condition. Most surveys also cover planted areas and irrigation meters.
Can tree canopies be mapped from aerial imagery?
Yes. Canopies and planted areas show clearly on an orthophoto, and we map them with AI detection and an interpreter's review. Heights come from a 3D model where one exists. Attributes such as species and trunk diameter need an on-foot survey.
Does the survey include an arborist's assessment?
The survey maps and records trees and the agreed attributes. Health and value assessments, or an opinion for a felling request, are made by a qualified arborist or agronomist. The survey layers give them a mapped basis to work from.
What is a green-space and water-meter survey?
A survey that maps the municipality's planted areas together with the meters that irrigate them. You can see which meter serves each green area, and build consumption and maintenance tracking by zone.
How does the survey help with shade planning?
Tree canopies and their heights are key inputs to street-level heat analysis. With them you can identify exposed streets and prioritise planting and shade structures from data.
How is the inventory kept up to date after the survey?
Layers are loaded into your GIS, and a field update form can be added for parks staff, so every planting, felling or pruning job is reflected on the map. The canopy layer is refreshed with each new orthophoto.
CH.06TC 00:08:18:17
How many trees does your municipality have?
If there is no precise answer, it is time for a survey. Together we will define what is mapped from the air, what in the field, and which attributes your parks team needs.