
Implementation & support · A regional council
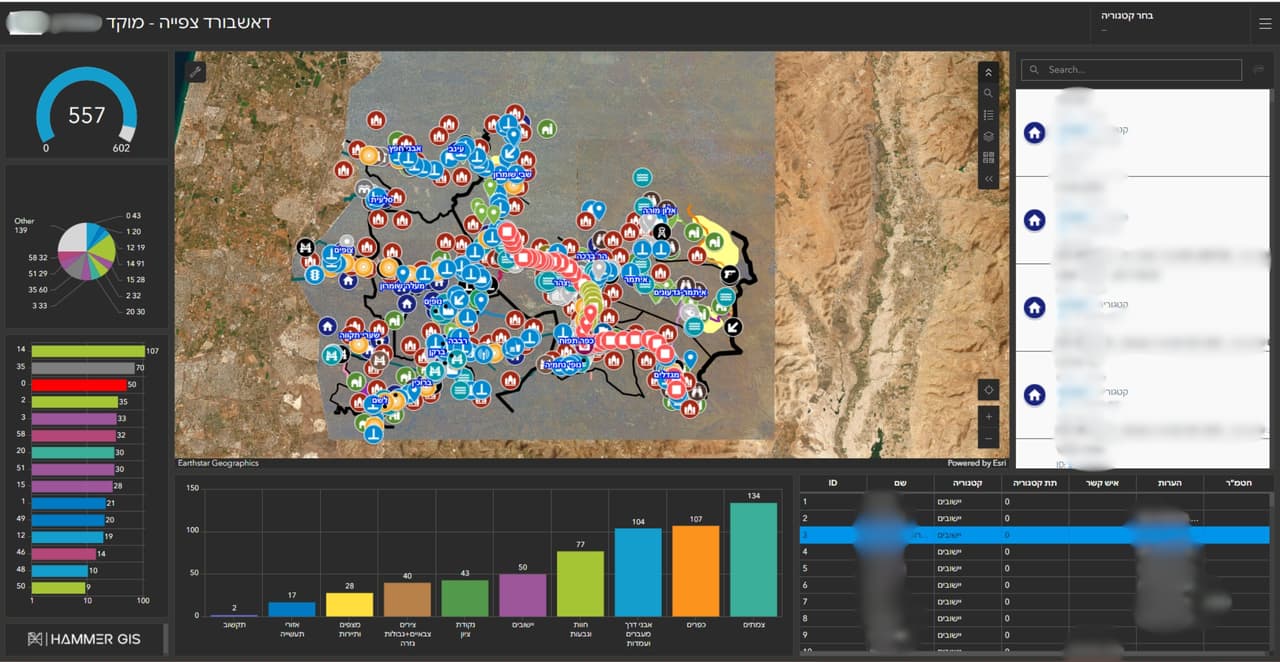
GIS system and call-centre dashboard for a regional council
A GIS system for the council, a call-centre dashboard with a map and charts, and external links that open straight from the map.
Call-centre dashboard: map points and charts
Project details
- Client
- A regional council
- Field
- Implementation & support
- Source
- Council ArcGIS
The challenge
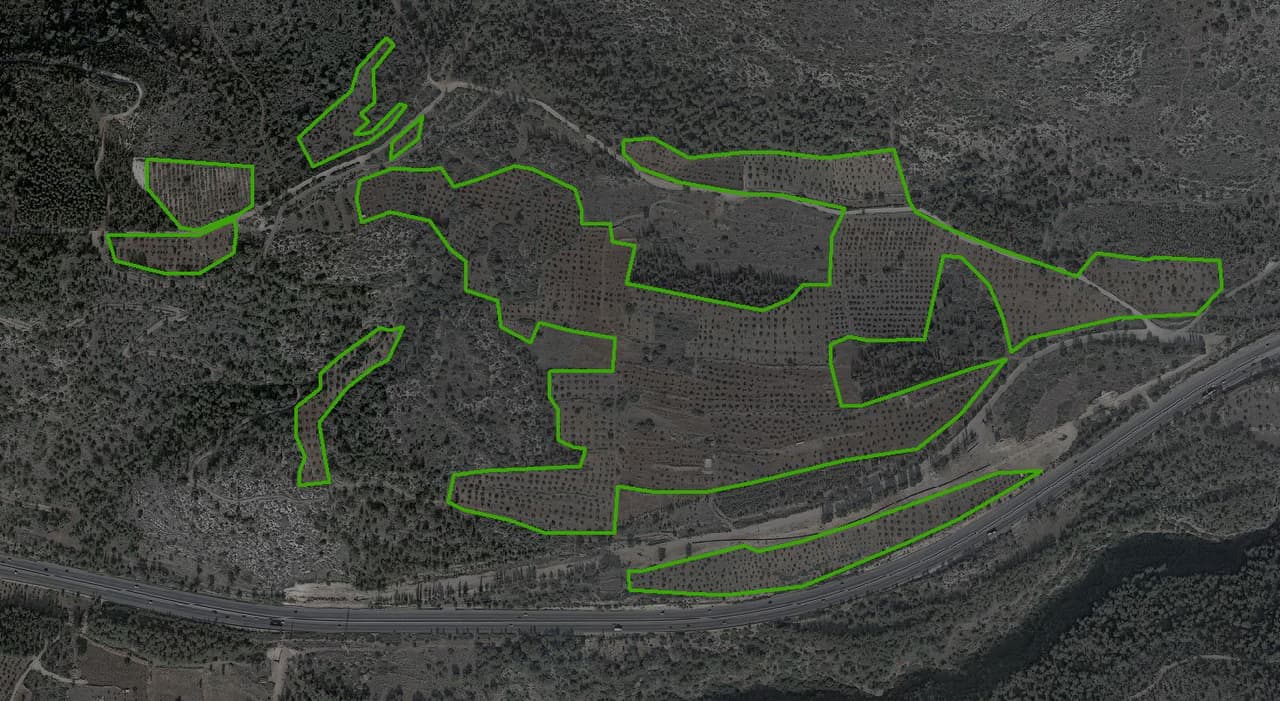
A regional council looks after many communities and large open areas, and information about them is spread across departments and systems. The call centre needs to see the picture on a map, and staff need to jump from the map to the relevant information without searching for it again.
The solution
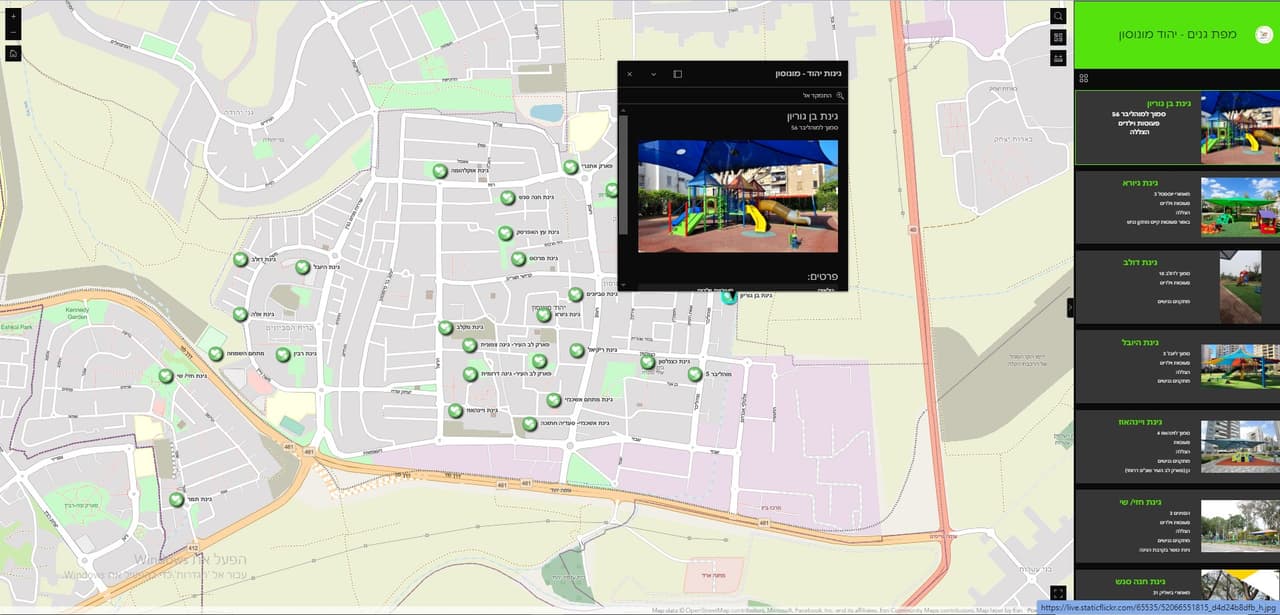
We set up a GIS system for the council on ArcGIS, together with a call-centre dashboard that shows the data on a map and in charts. External links were configured inside the map, leading from a feature to information about it outside the system. We continue to support the council as a GIS client.
The outcome
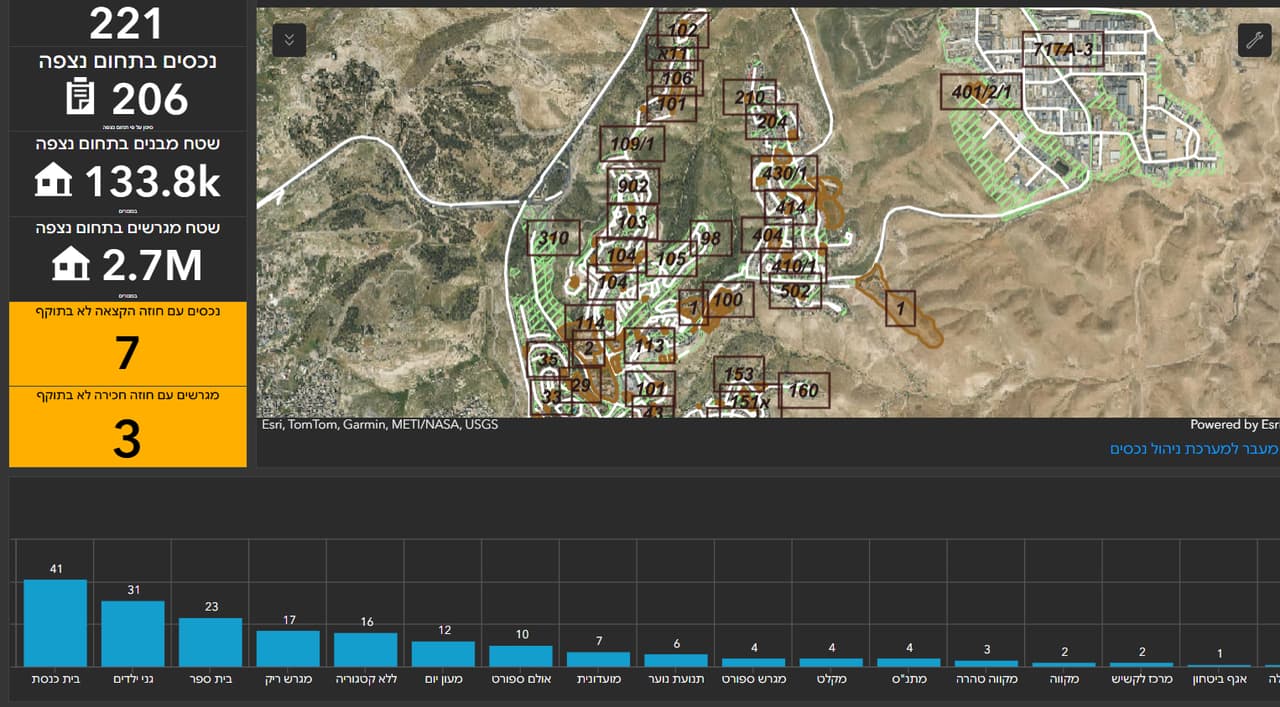
Council staff work from one GIS system, the call centre sees the situation on a map and in charts, and every feature on the map leads straight to the relevant information.
Delivered
- GIS system on ArcGIS
- Call-centre dashboard
- External links from the map
More projects
All projects-
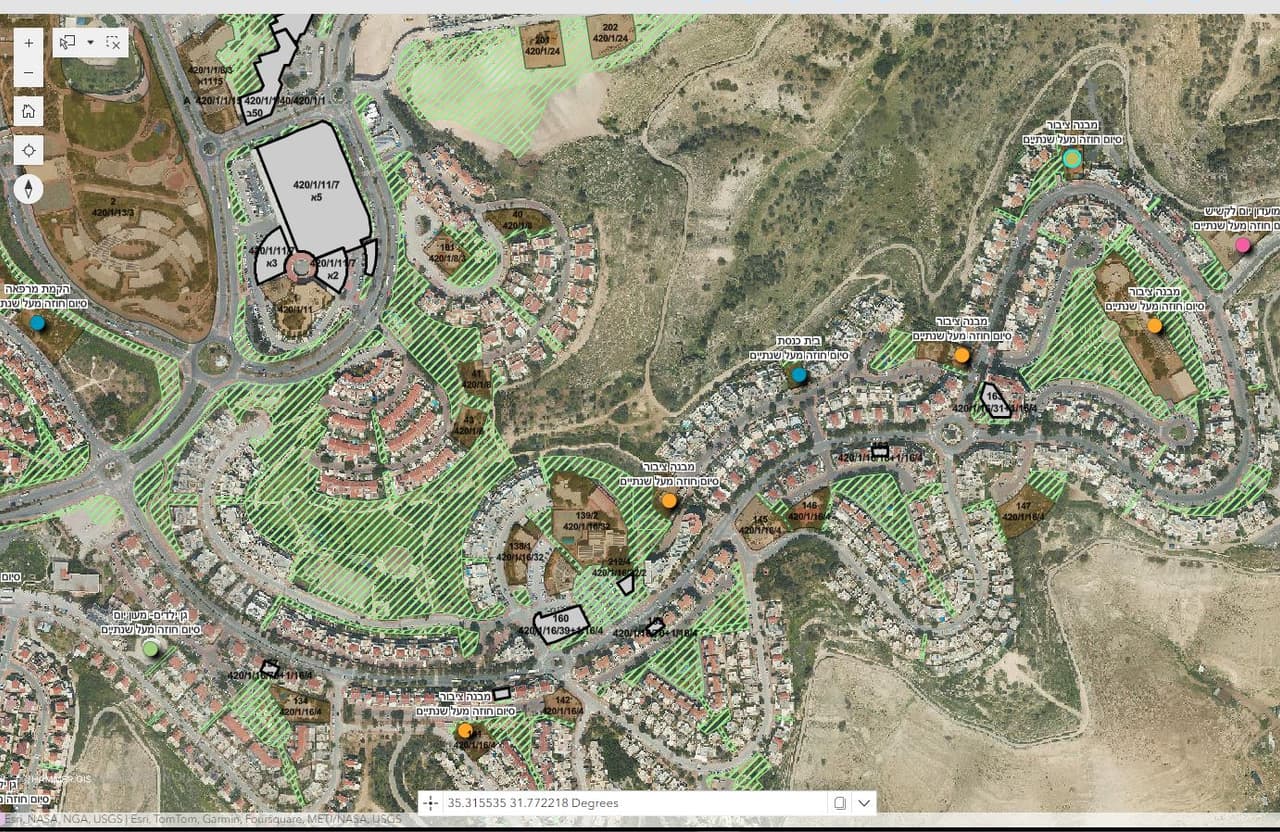
A municipal asset-management app
All of the authority's property on one map: assets, plots, lease contracts and allocations, with an editing map, an editing table, a survey form and an assets dashboard. -
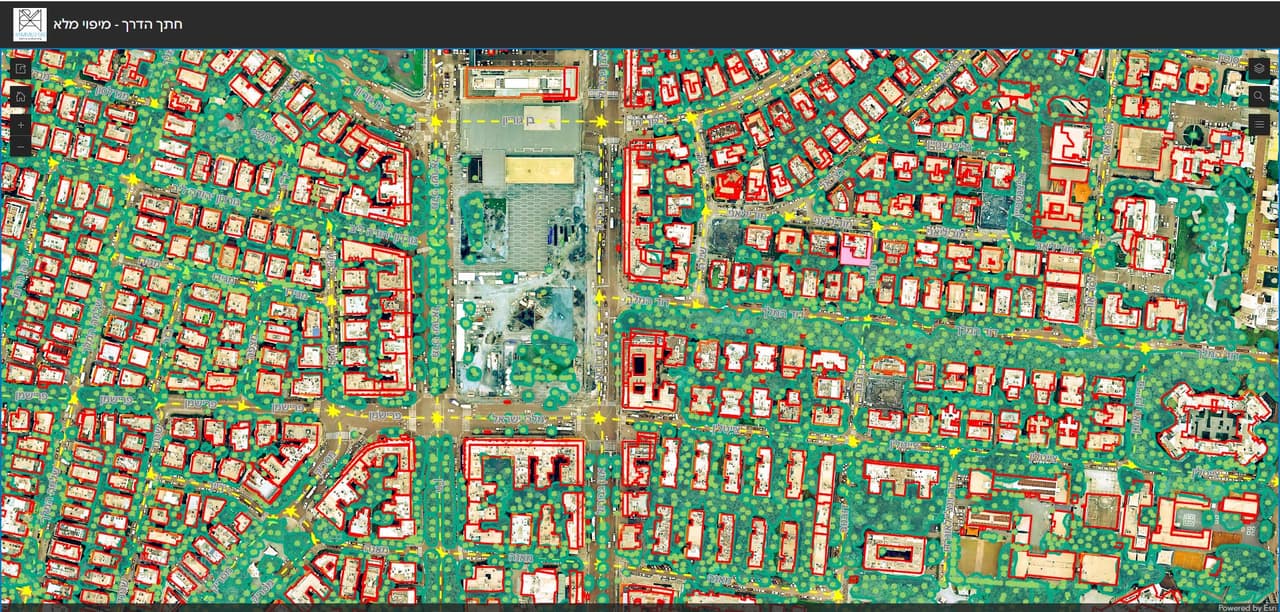
Resident maps: collection days, thematic maps and a road cross-section survey
ArcGIS Online apps for local authorities: waste and pruning collection days by address, comparison and thematic maps for residents, a road cross-section survey and self-survey forms. -
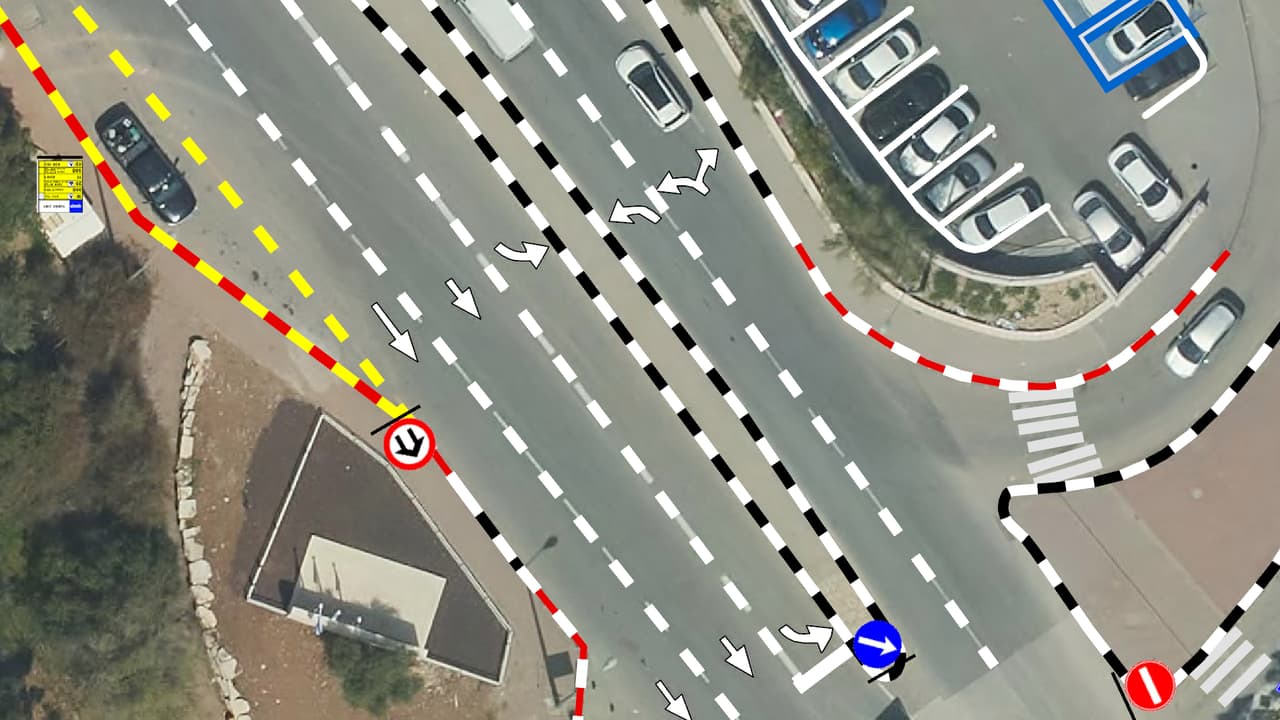
Vehicle survey of traffic signs and road markings
Camera vehicles with on-board AI, a person checking every frame, and every sign placed on the aerial photo: GIS layers of signs, poles and road markings, plus a transport app in ArcGIS Online.
Your next project
What do you want to move forward in your organisation?
Tell us what needs solving and we will come back with a proposed approach: a survey, a system, software, or a combination.