
Surveys · A local authority
Vehicle survey of traffic signs and road markings
Camera vehicles with on-board AI, a person checking every frame, and every sign placed on the aerial photo: GIS layers of signs, poles and road markings, plus a transport app in ArcGIS Online.
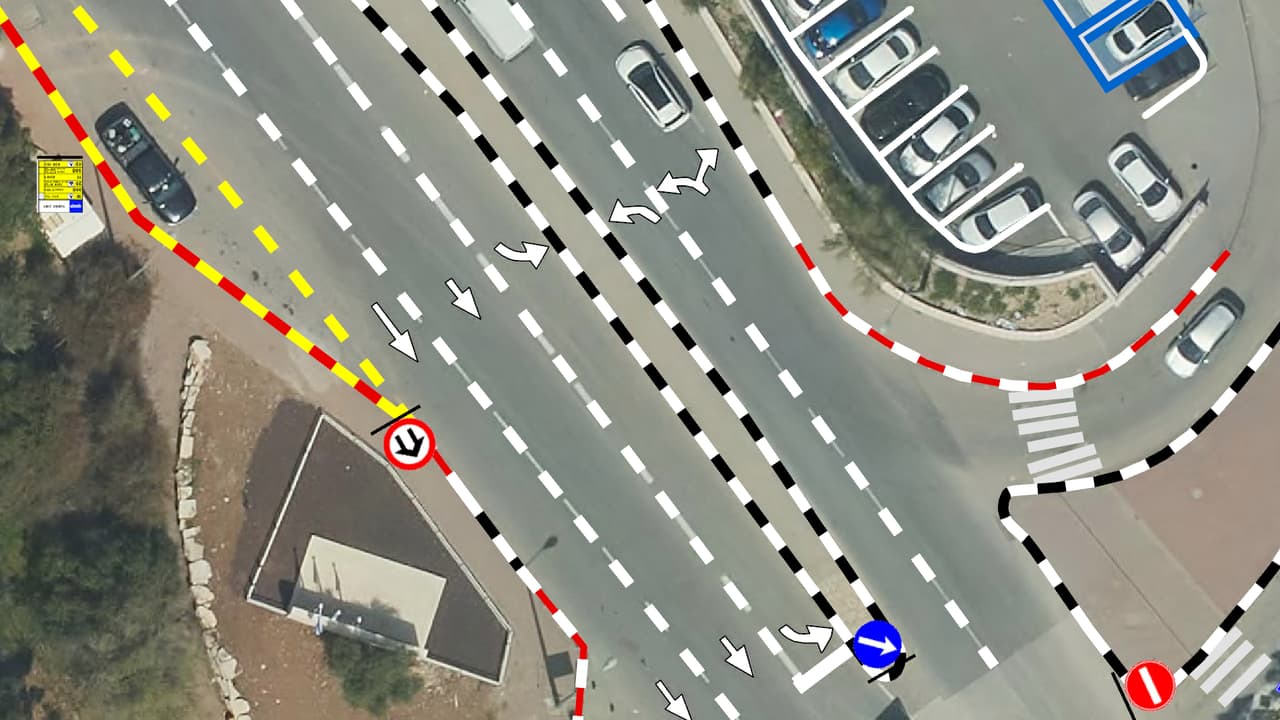
Vector road markings and signs on a multi-lane road
Project details
- Client
- A local authority
- Field
- Surveys
- Source
- 180°/360° vehicle imagery · aerial photo
The challenge
A local traffic authority needs to know what stands on every street: which sign, on which pole, facing which way, and which markings are painted on the road. Without that inventory, every traffic plan starts with a site visit and every resident request has to be checked from scratch.
The solution
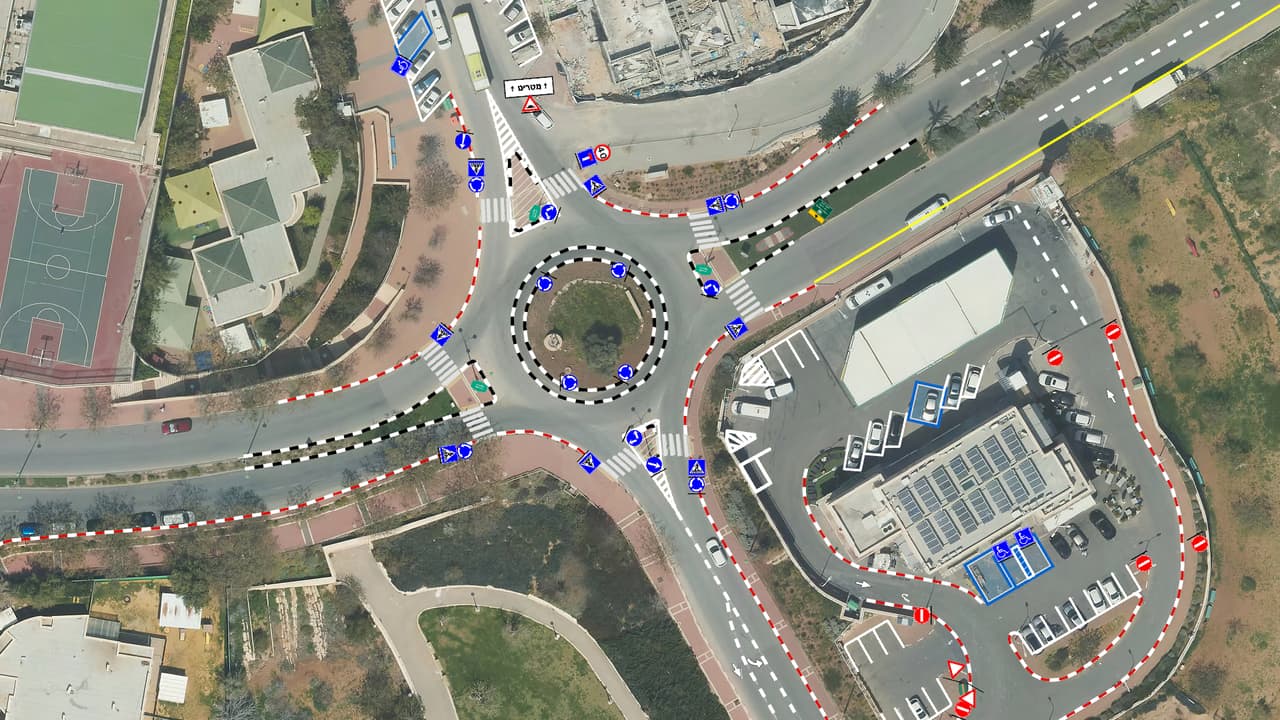
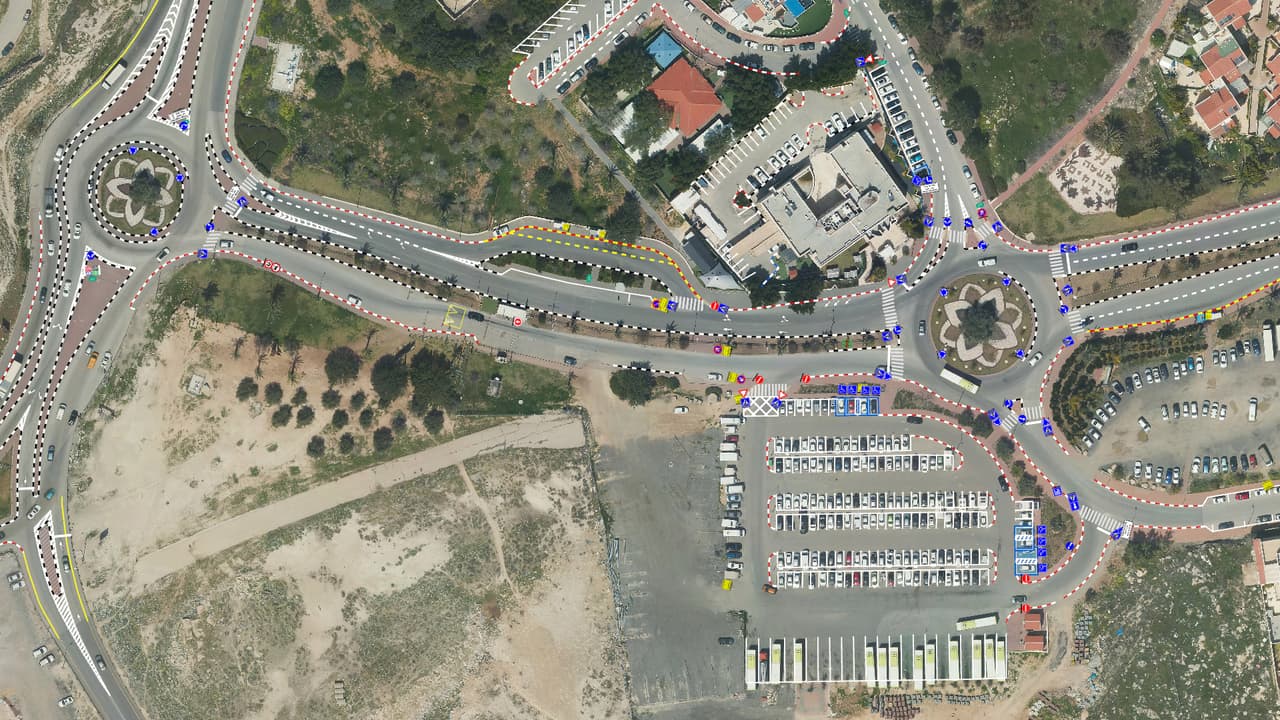
Vehicles with 180° and 360° cameras drove the city's streets while an on-board AI computer flagged signs in the imagery. A trained team then went through the images one by one, confirmed each detection and placed every sign on the aerial photo according to the Ministry of Transport sign book. Each sign carries its sign code, an address based on the Central Bureau of Statistics street code, its facing direction in degrees, a unique ID and a pole number. Road markings were built as line and polygon layers: bus stops including accessibility, pedestrian crossings, no-parking zones, speed bumps and disabled parking. Everything was loaded into a transport and traffic app in the city's ArcGIS Online.
The outcome
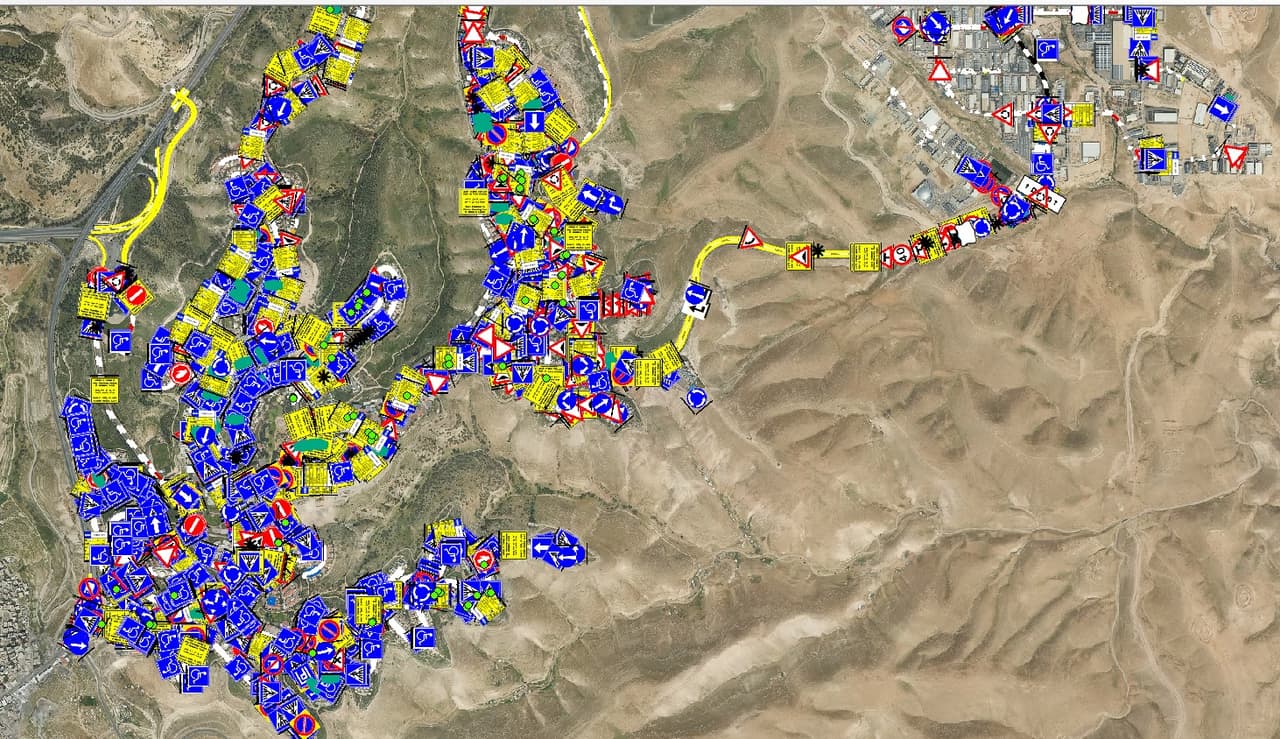
The traffic team finds any sign by street, code or pole, opens the street image it was captured in, and works from one layer with a known source and date. Traffic plans and resident requests now start from the map, not from a drive around town.
Delivered
- Point layer of pole-mounted signs: sign code, address, direction, ID and pole number
- Pole layer with coordinates and the number of signs per pole
- Line and polygon layers of road markings
- All street images from the survey
- Transport and traffic app in ArcGIS Online
More projects
All projects-
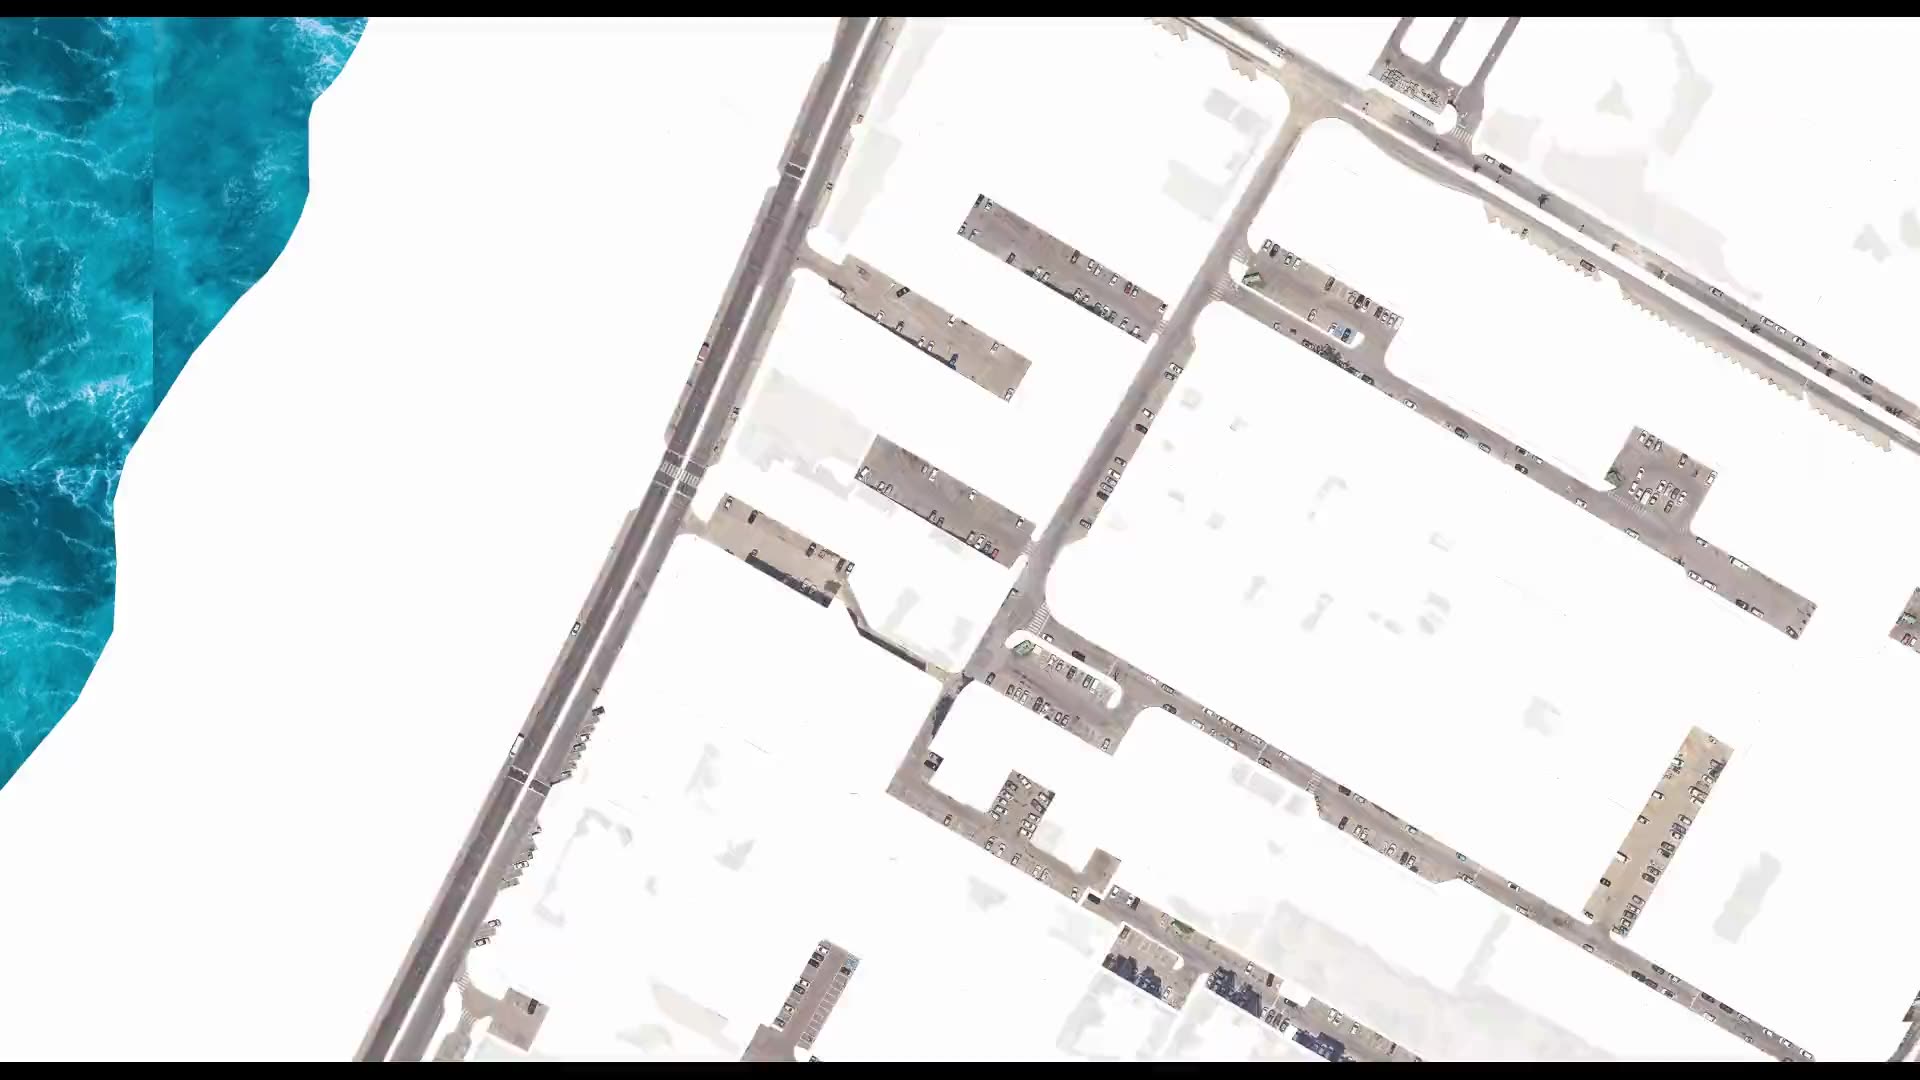
Street-level urban heat-island map – Kiryat Yam
Heat factors coded from the aerial photo, shade computed every half hour, and all of it combined into one shading priority map at the level of streets, paths and bus stops. -
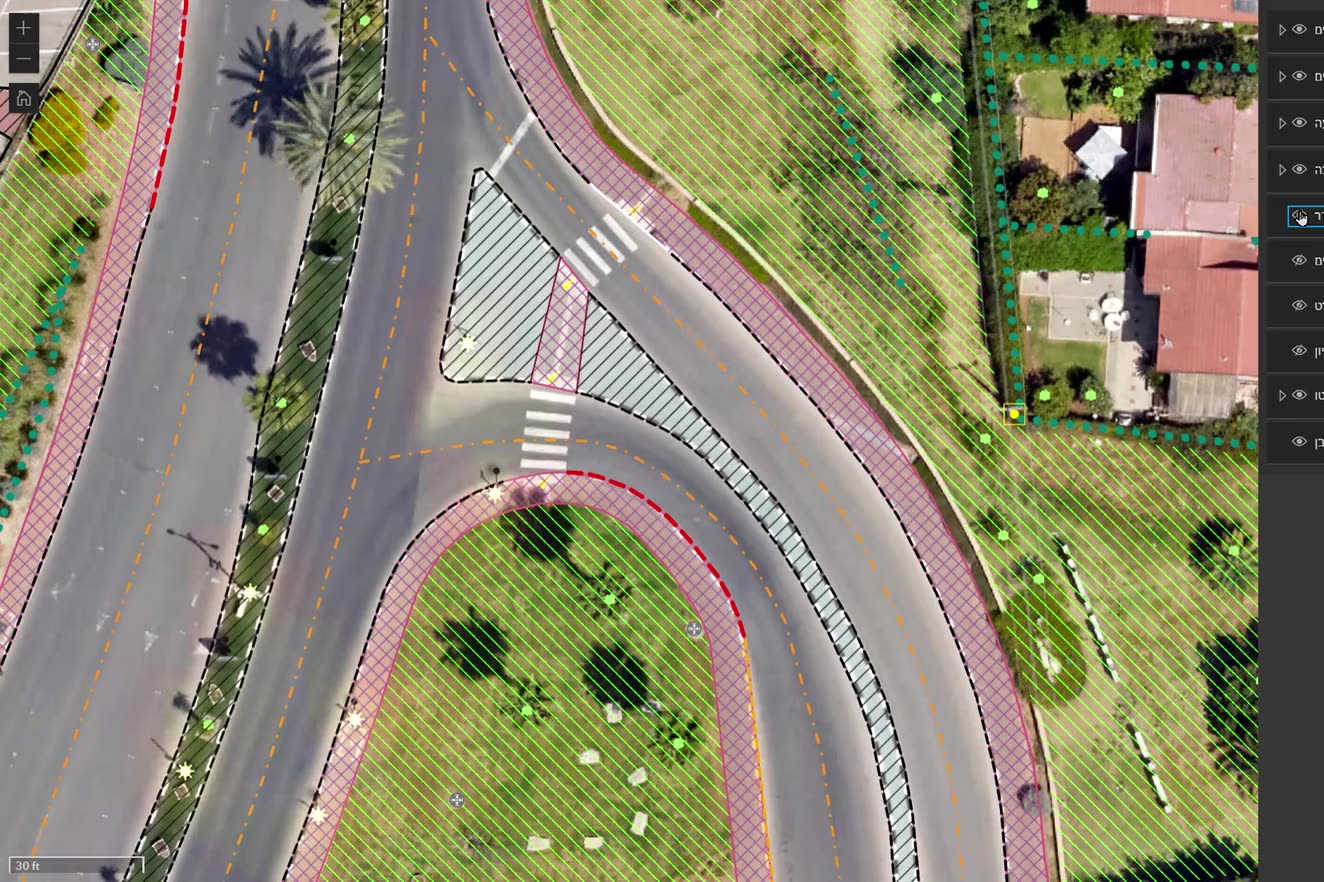
Ortho-graphy: city base layers from an aerial photo
Machine recognition on the authority's own aerial photo, manual completion and full QC: buildings, pavements, drainage, poles, signs, trees and more, with heights, in GIS, DWG and PDF. -
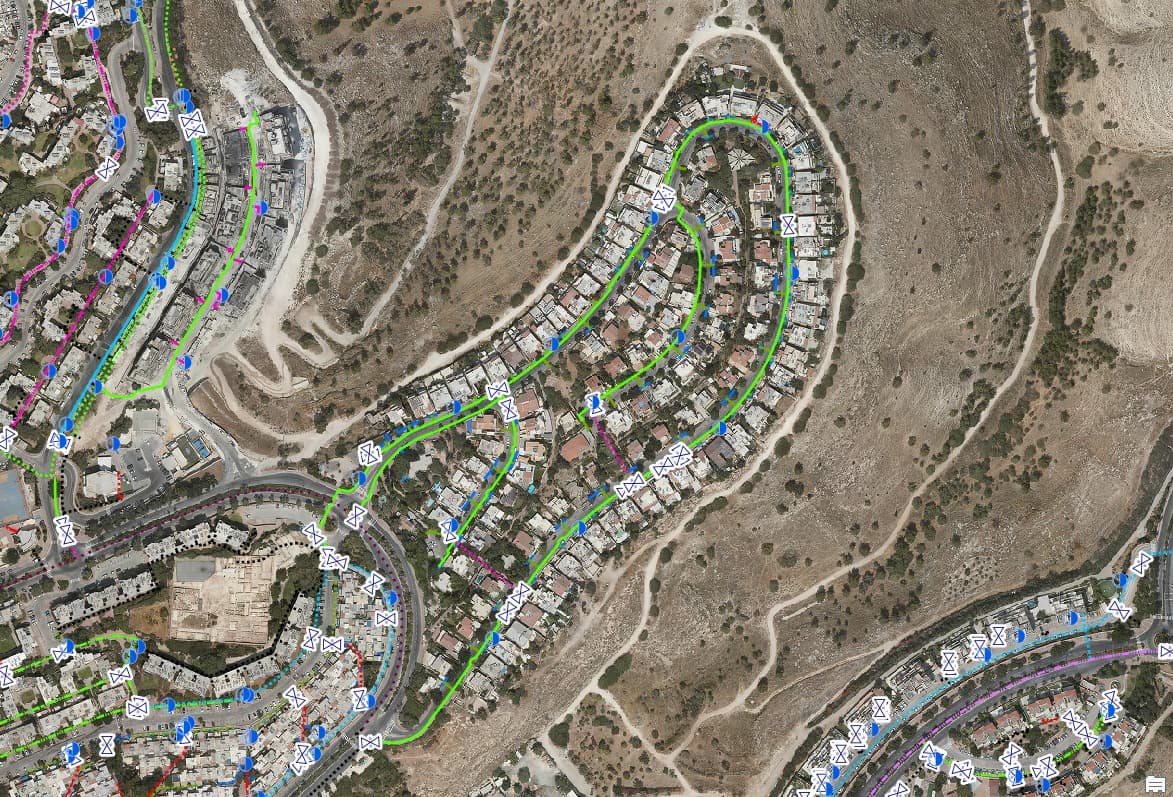
Drainage surveys: inlets, manholes and lines on the map
Urban drainage infrastructure mapped on the aerial photo for two authorities: inlets, manholes, drainage lines and inlet lines, with a city-wide survey map and a dashboard.
Your next project
What do you want to move forward in your organisation?
Tell us what needs solving and we will come back with a proposed approach: a survey, a system, software, or a combination.