
Surveys · Kiryat Yam Municipality
Street-level urban heat-island map – Kiryat Yam
Heat factors coded from the aerial photo, shade computed every half hour, and all of it combined into one shading priority map at the level of streets, paths and bus stops.
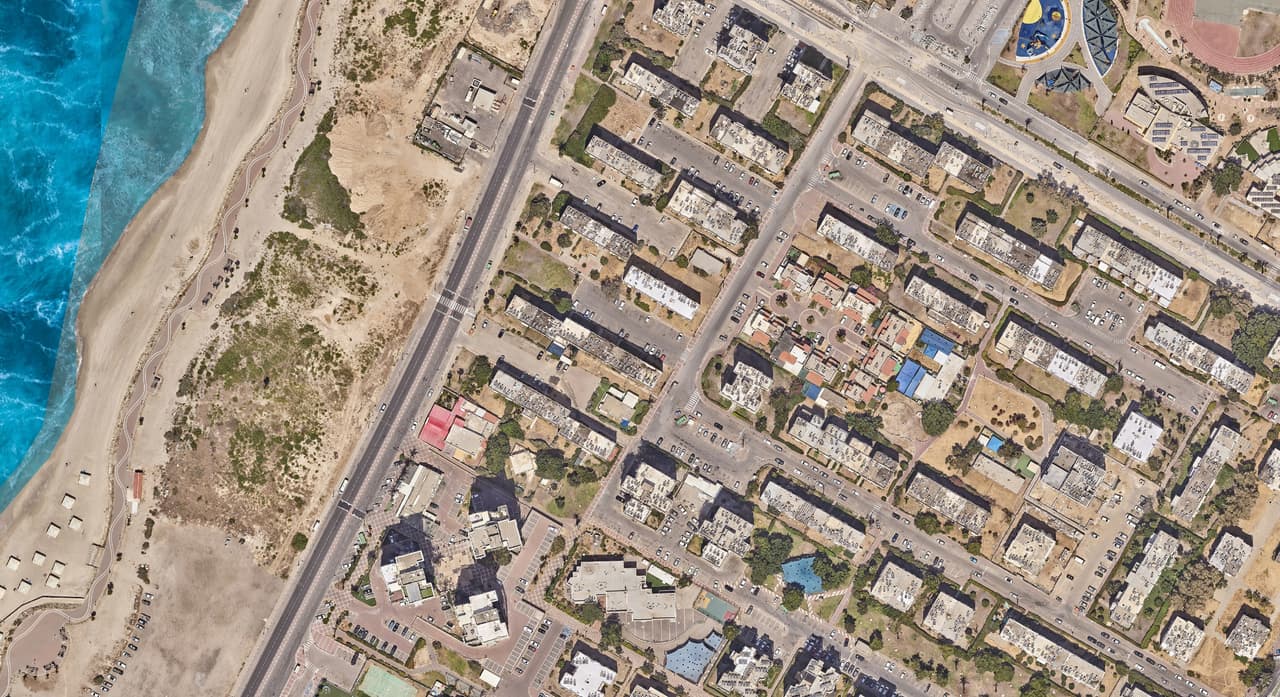
Coastal neighbourhood: streets, ortho, shade, heat
Project details
- Client
- Kiryat Yam Municipality
- Field
- Surveys
- Source
- Aerial photo · height data
- Date
- 2024-06
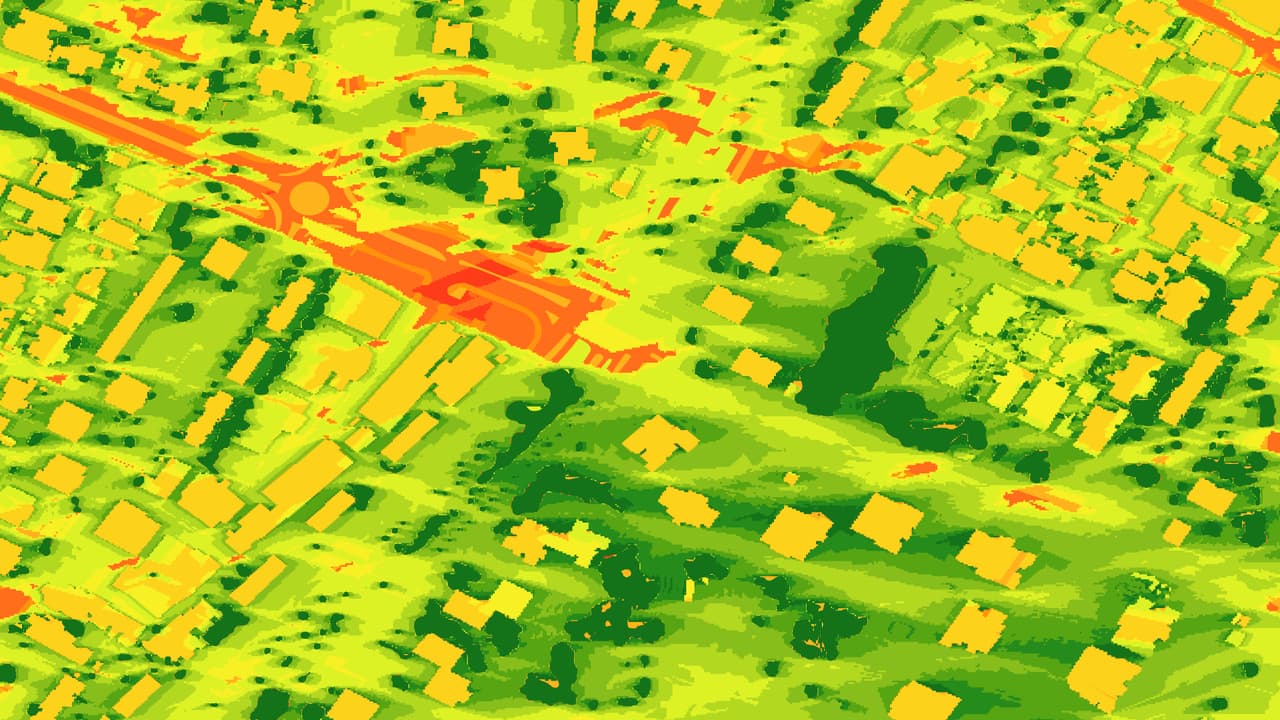
The challenge
On a hot afternoon, the difference between a shaded street and an exposed one is felt with every step. To decide where to plant trees or add shade, planners need to see heat at the level of a pavement, a path or a bus stop, and a general city heat map does not answer that question.
The solution
From the aerial photo we coded everything that drives heat in a street: tree canopies and their heights, shade structures and umbrellas with heights, vegetation, asphalt, pavements and paths, artificial surfaces, hedges, green areas, buildings with heights, and open ground. Using the heights, we cast shade every half hour across the day. A model that combines radiation, sun exposure, shade and the thermal response of each material produced an urban heat-island priority map.
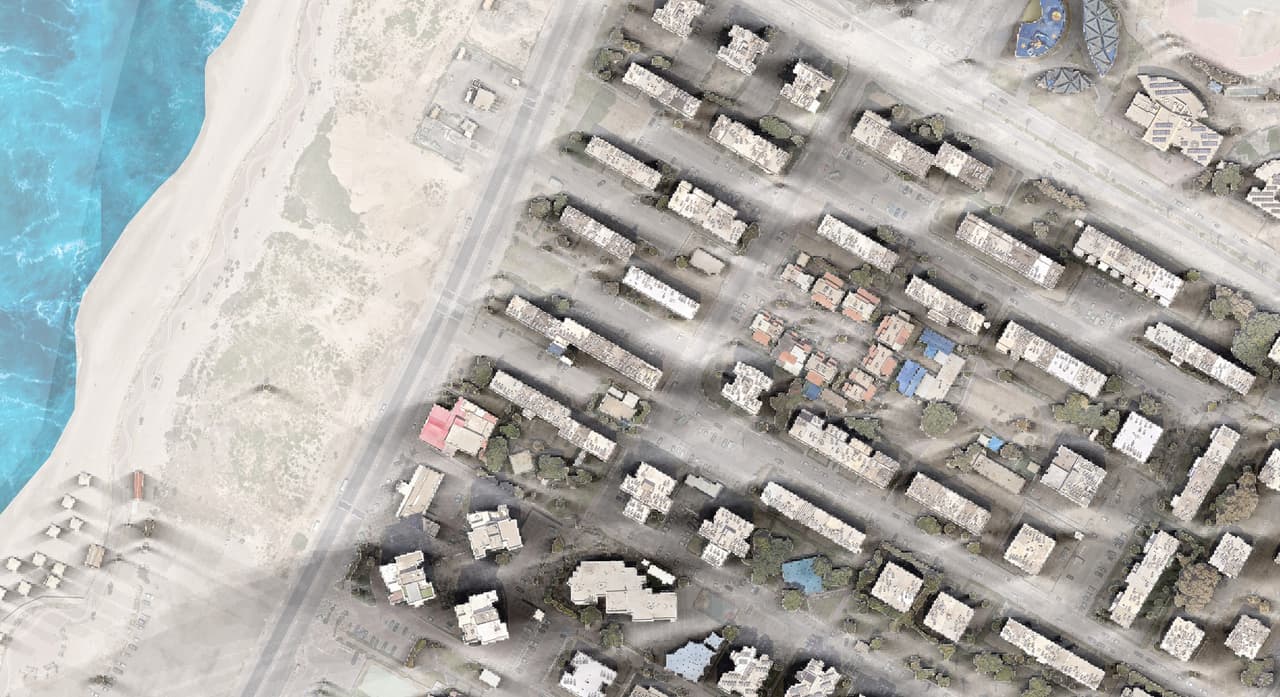
The outcome
The city now has a map that shows which streets, paths and bus stops run hottest and why, so tree planting and shade can be prioritised in shade-oriented planning. The layers were delivered as GIS and DWG, so planners who work in CAD can use them too.
Delivered
- Heat-factor layers: trees, shade structures, vegetation, asphalt, pavements, surfaces and buildings, with heights
- Shade casting every half hour across the day
- Urban heat-island priority map in GIS and DWG
- A0 map poster
From the field: footage from the work
-
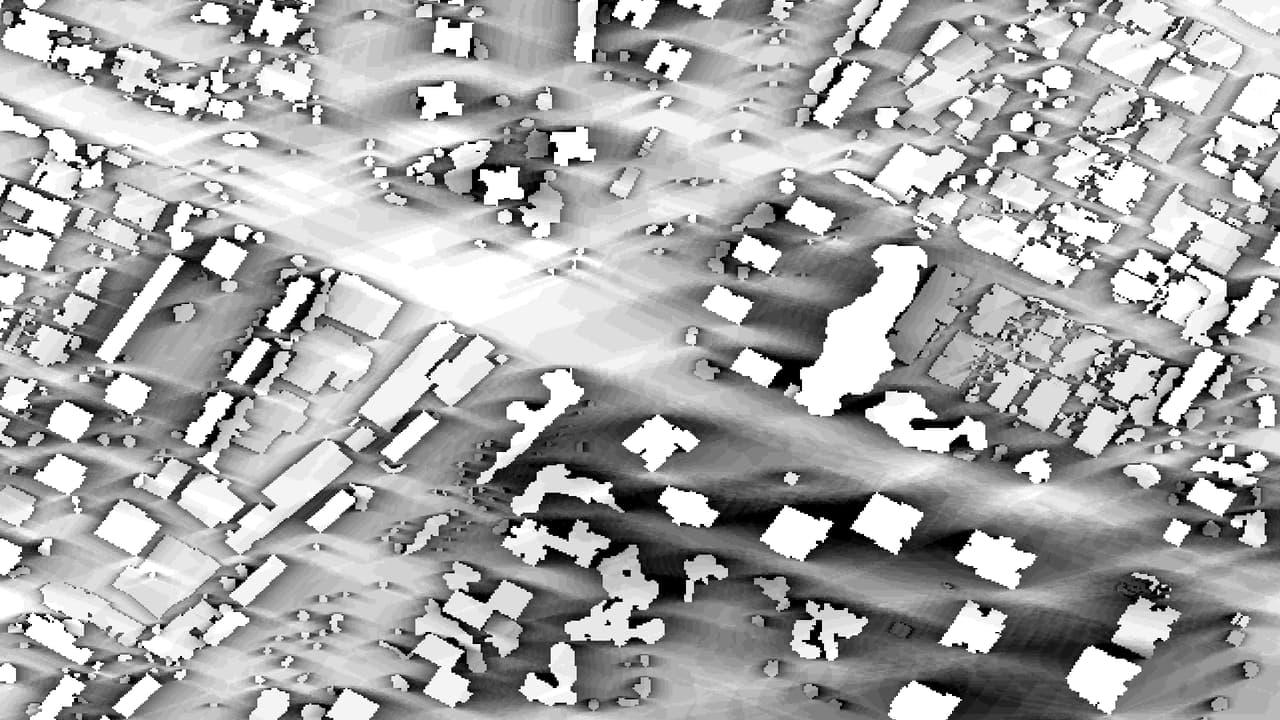
Shade raster: buildings casting shadows -
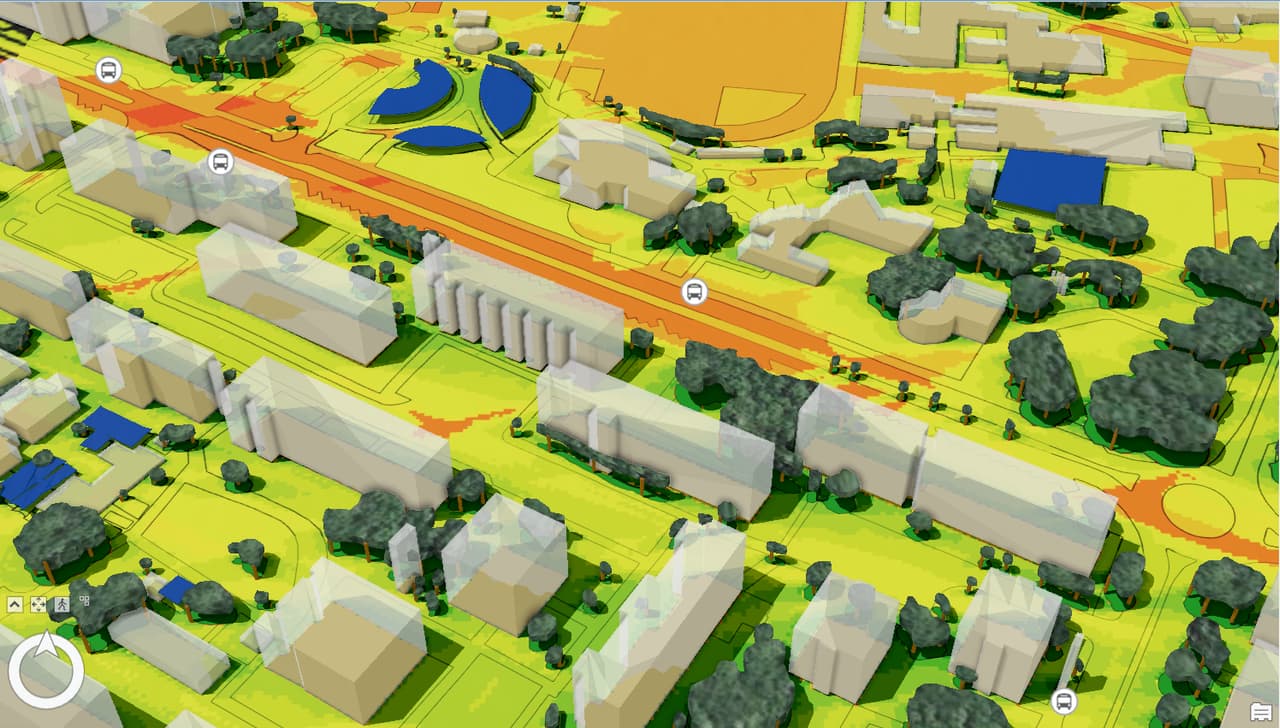
Heat-coloured 3D model around a bus stop -
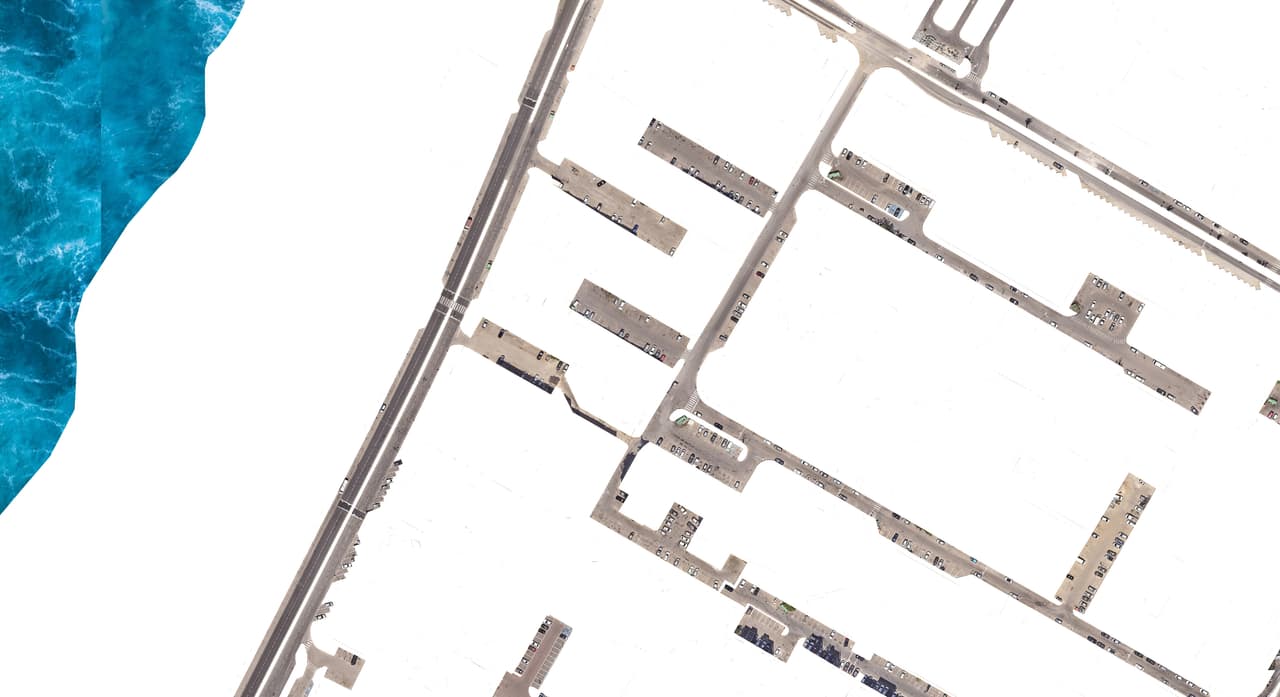
The neighbourhood street network as vector lines -
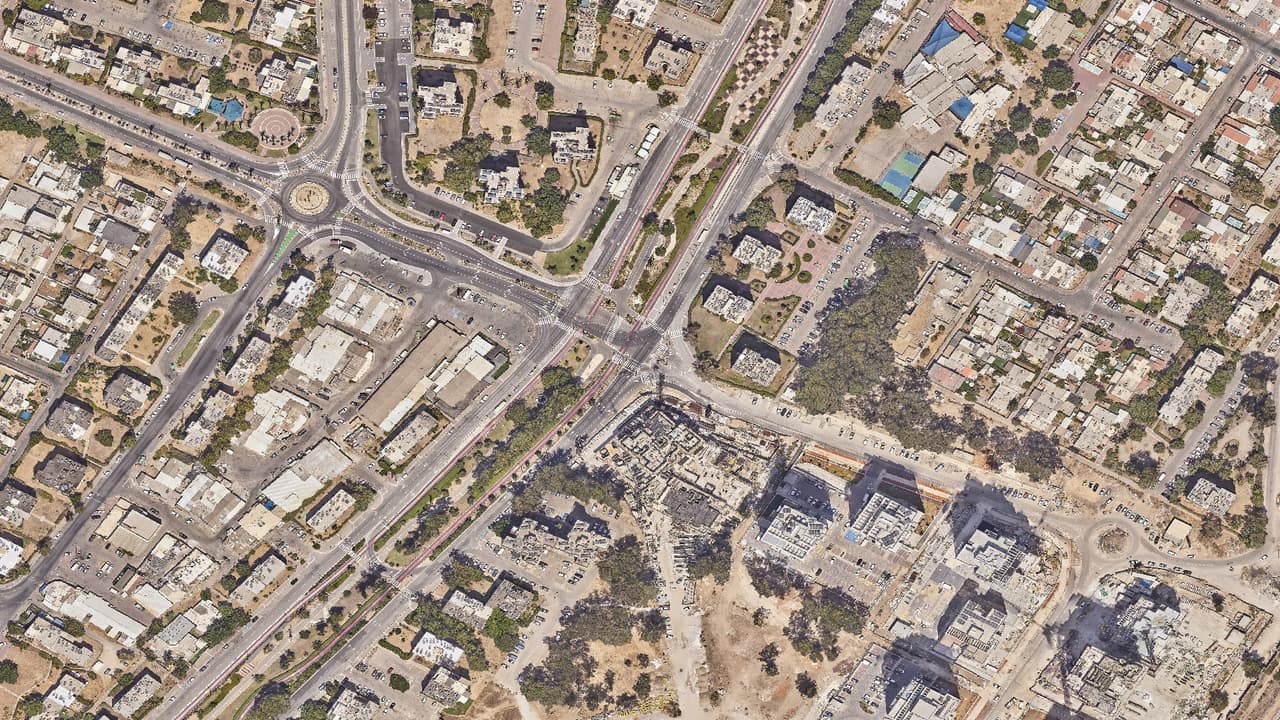
Orthophoto of a city centre with a roundabout
More projects
All projects-
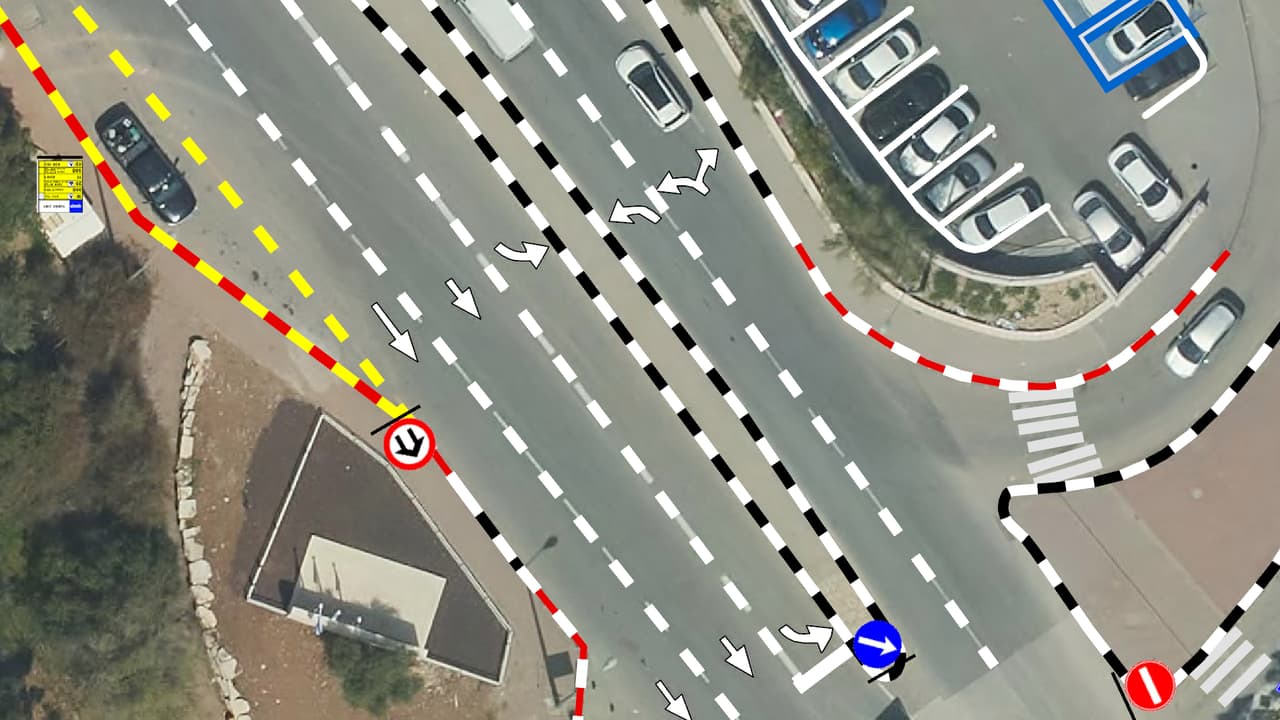
Vehicle survey of traffic signs and road markings
Camera vehicles with on-board AI, a person checking every frame, and every sign placed on the aerial photo: GIS layers of signs, poles and road markings, plus a transport app in ArcGIS Online. -
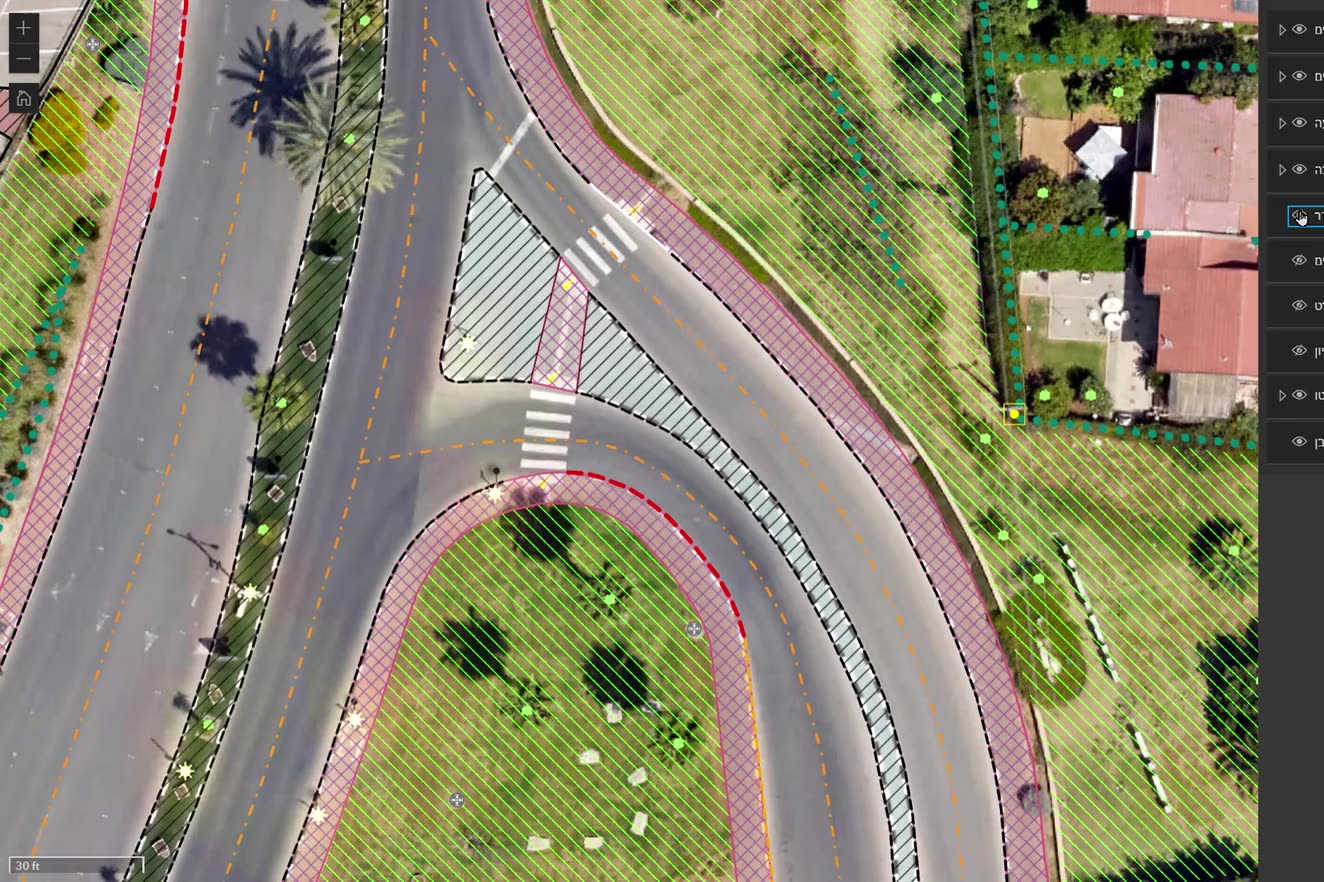
Ortho-graphy: city base layers from an aerial photo
Machine recognition on the authority's own aerial photo, manual completion and full QC: buildings, pavements, drainage, poles, signs, trees and more, with heights, in GIS, DWG and PDF. -
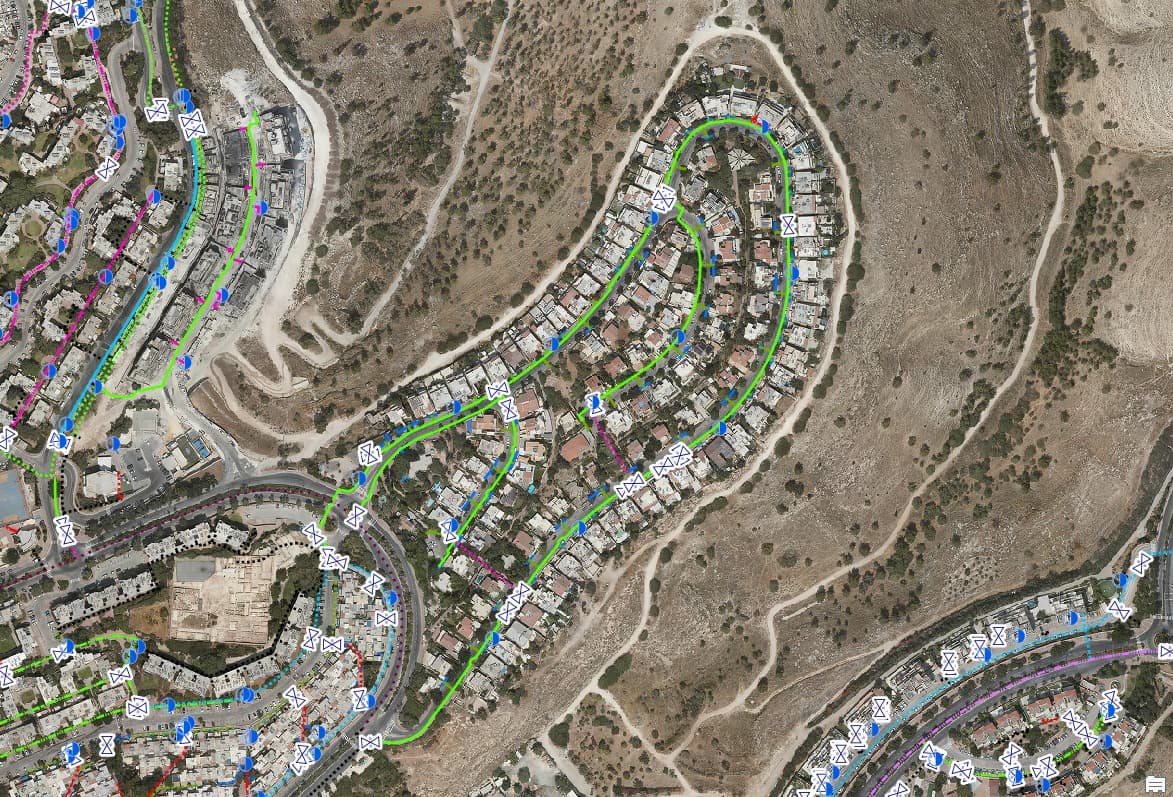
Drainage surveys: inlets, manholes and lines on the map
Urban drainage infrastructure mapped on the aerial photo for two authorities: inlets, manholes, drainage lines and inlet lines, with a city-wide survey map and a dashboard.
Your next project
What do you want to move forward in your organisation?
Tell us what needs solving and we will come back with a proposed approach: a survey, a system, software, or a combination.