
Surveys · Local authorities
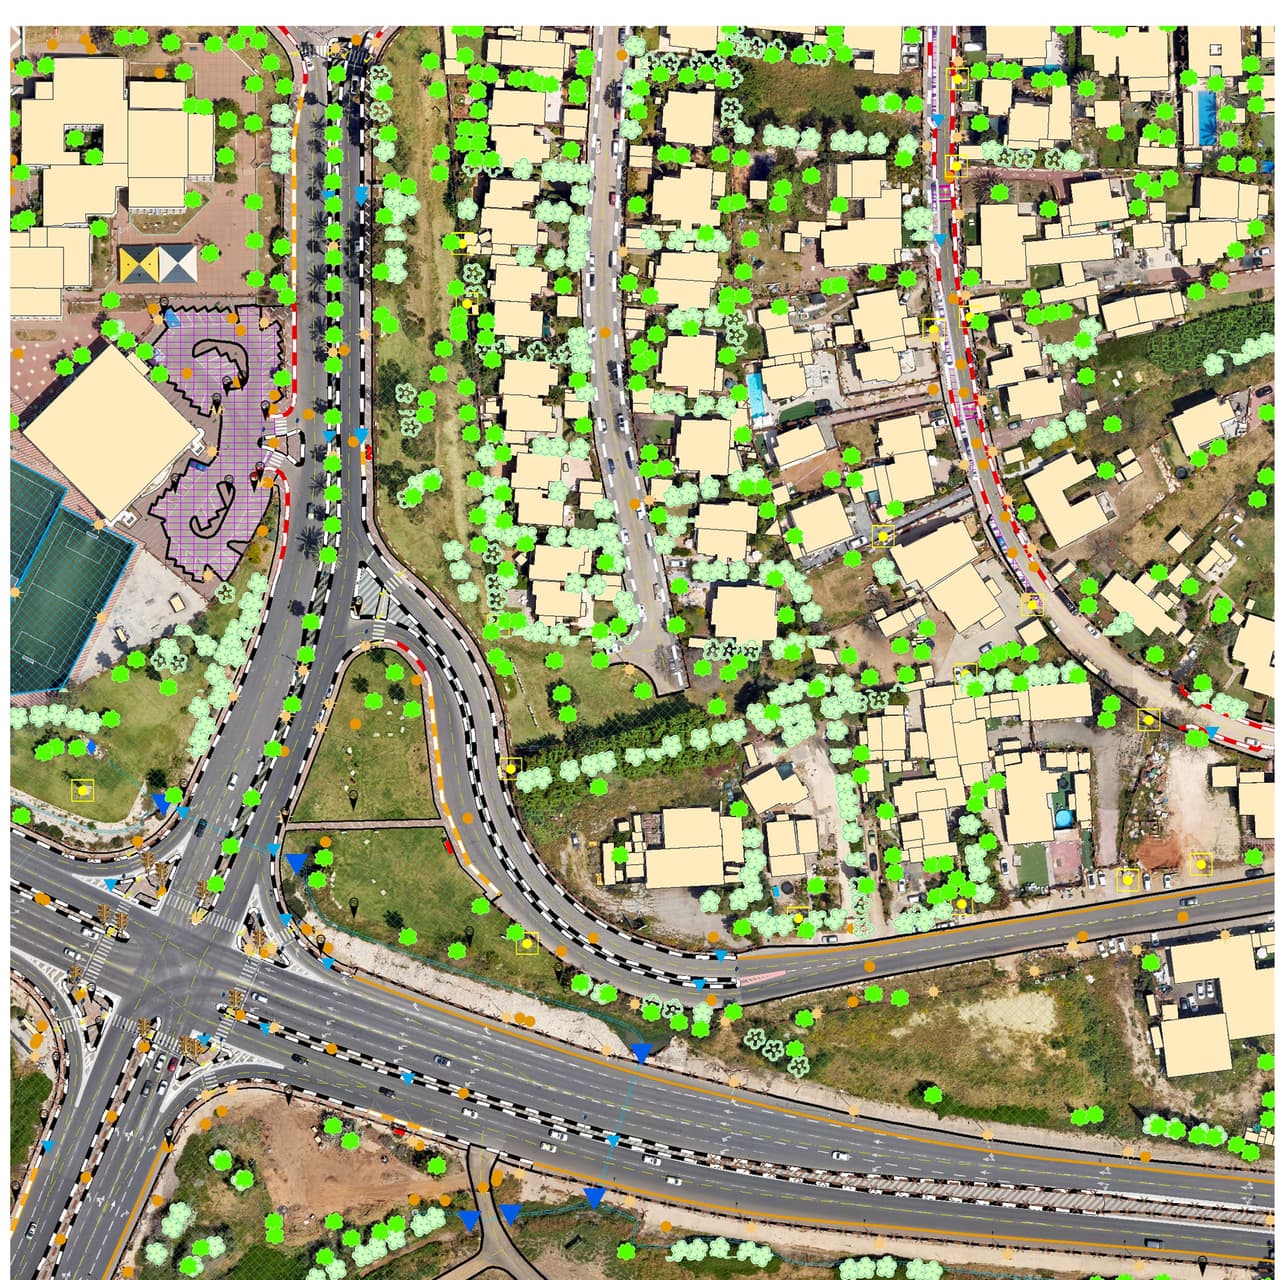
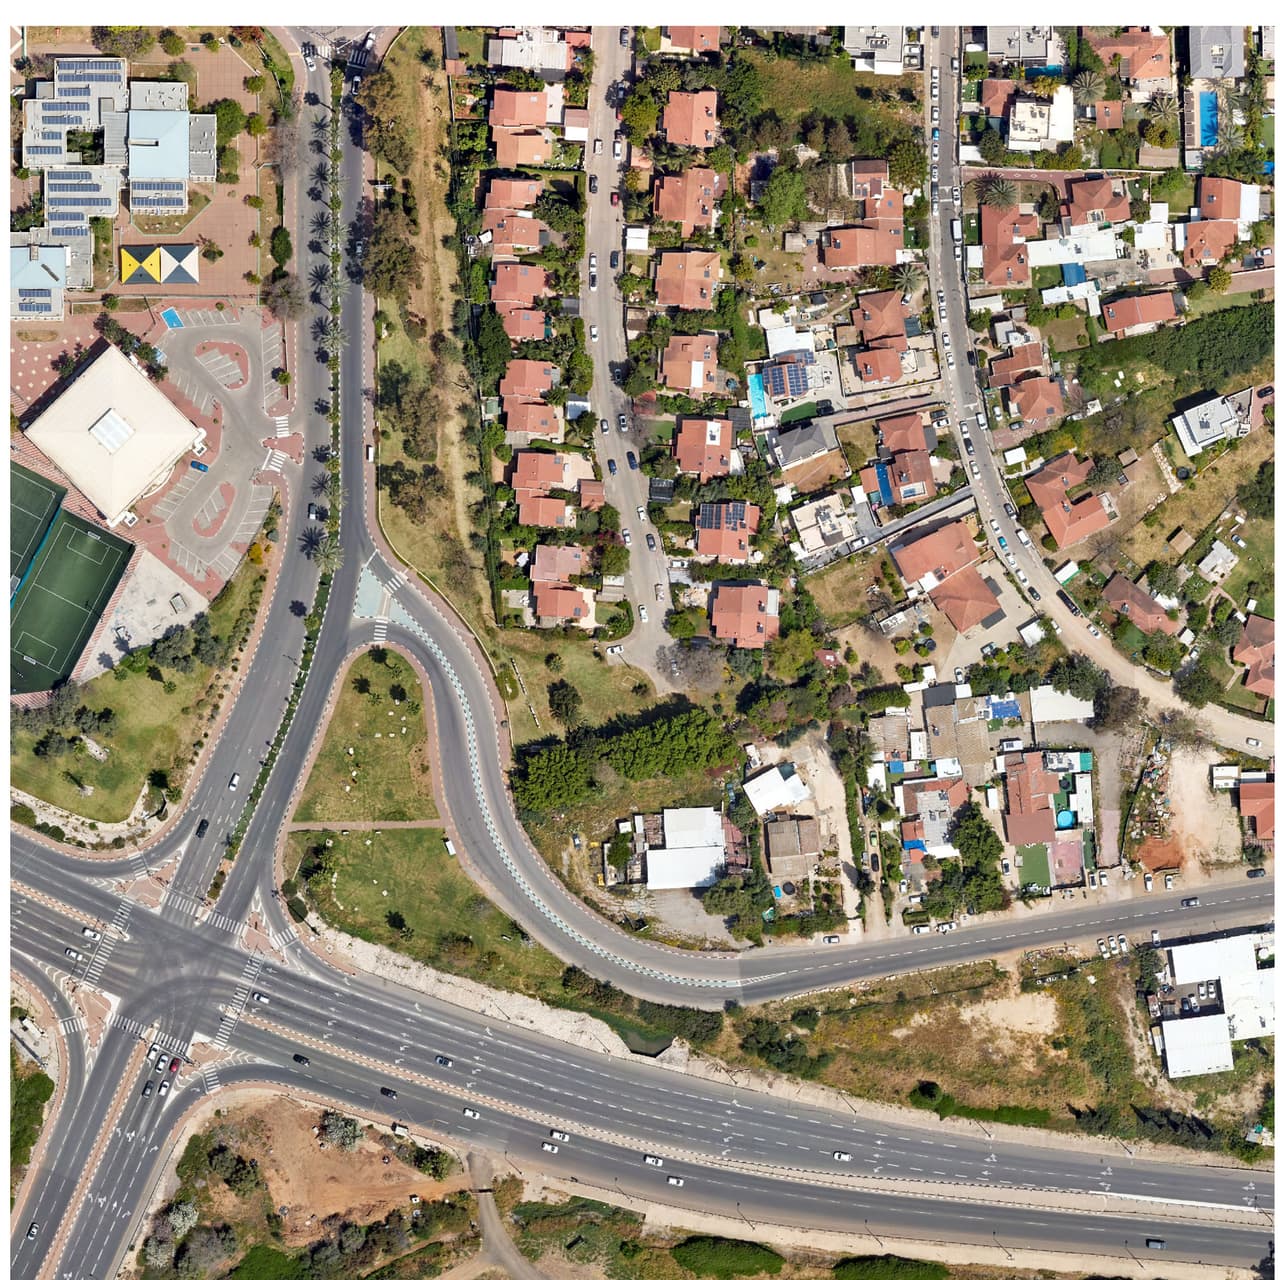
Ortho-graphy: city base layers from an aerial photo
Machine recognition on the authority's own aerial photo, manual completion and full QC: buildings, pavements, drainage, poles, signs, trees and more, with heights, in GIS, DWG and PDF.
Aerial photo becoming layers: crossings, pavements, plants
Project details
- Client
- Local authorities
- Field
- Surveys
- Source
- Client aerial photo · 3D model
The challenge
Base layers are usually built slowly: buildings in one project, pavements in another, trees perhaps a few years later. Meanwhile a recent aerial photo is already sitting with the authority, and what it shows does not yet exist as a layer anyone can filter, measure or maintain.
The solution
We ran machine recognition (AI) over the authority's existing aerial photo to flag features. Interpreters then completed by hand whatever the machine missed and checked every feature, with heights taken from the 3D model. Depending on the brief, the layers cover buildings, drainage inlets, manholes, culverts, fire hydrants, pavements and kerb colour, poles, signs, traffic lights, bus stops, bike lanes, roundabouts, parking, roads, traffic islands, lane lines, trees, shrubs and fences.
The outcome
The authority gets a full set of base layers for a whole area in a single project and works with it in its own system: counting, measuring, planning maintenance and using the layers as the starting point for future surveys.
Delivered
- GIS layers from the aerial photo, to a layer list agreed with the authority
- Heights from the 3D model
- DWG and PDF files
From the field: footage from the work
-
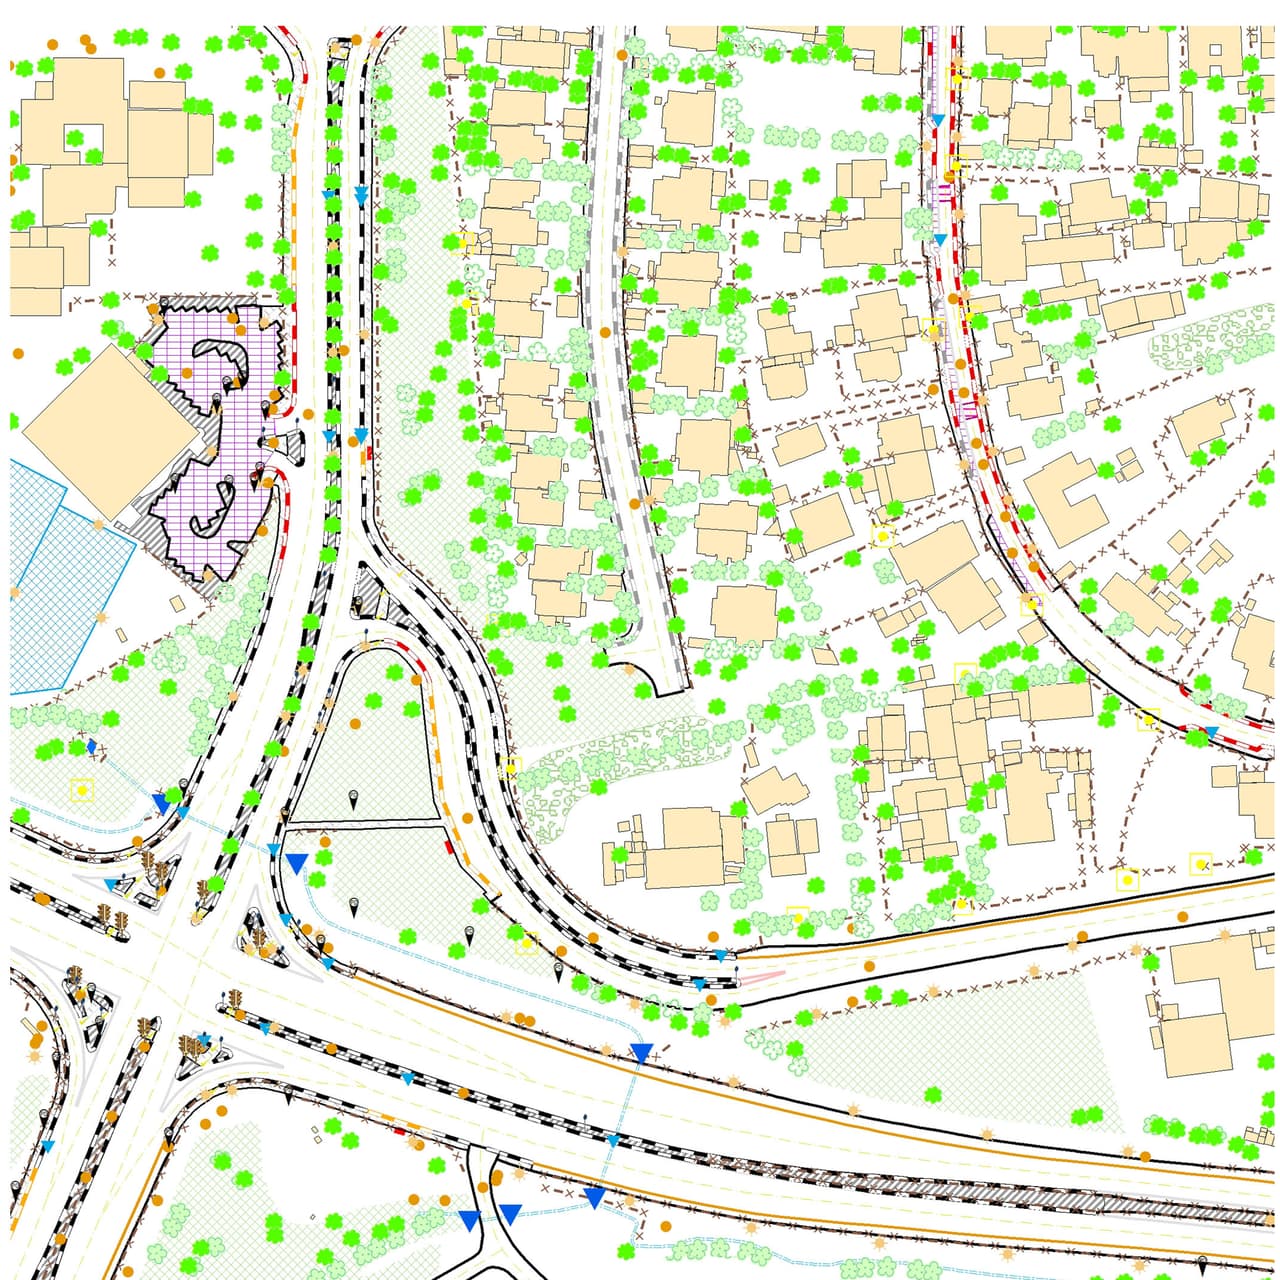
Layers only: the data taken from the photo -
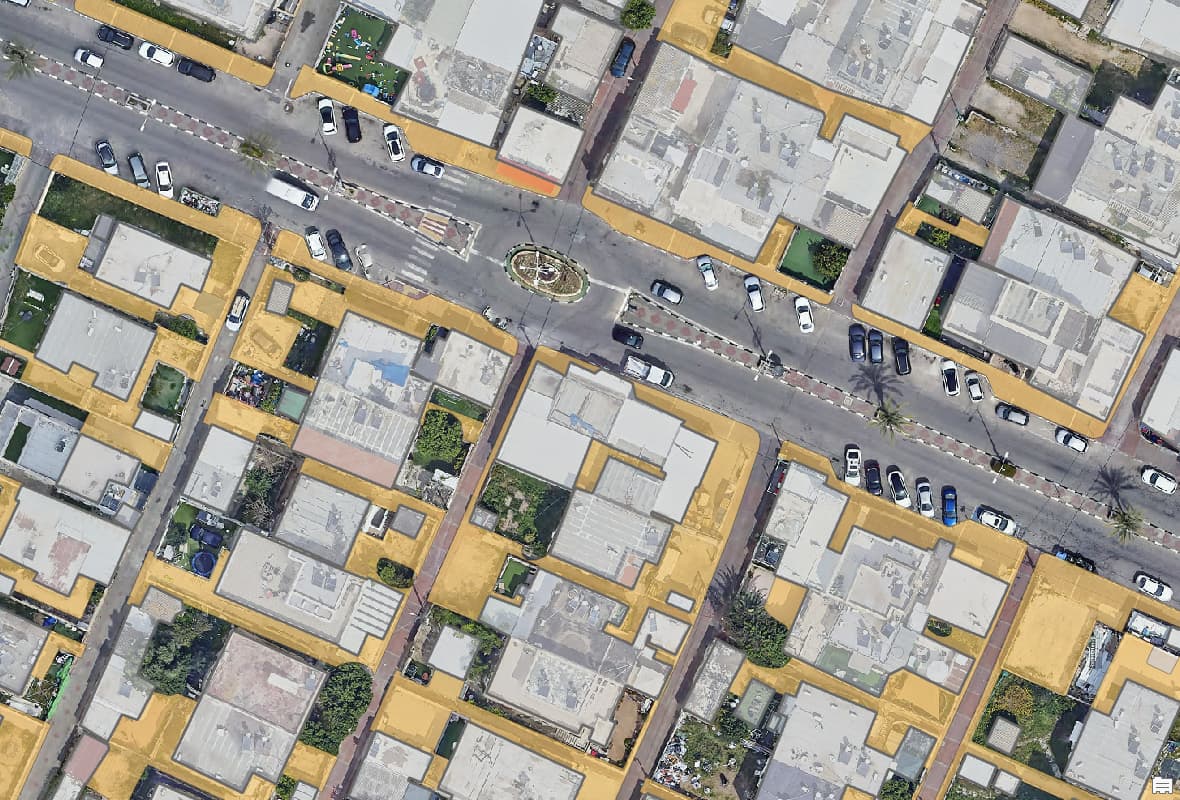
Buildings and pavements mapped in a coastal city -
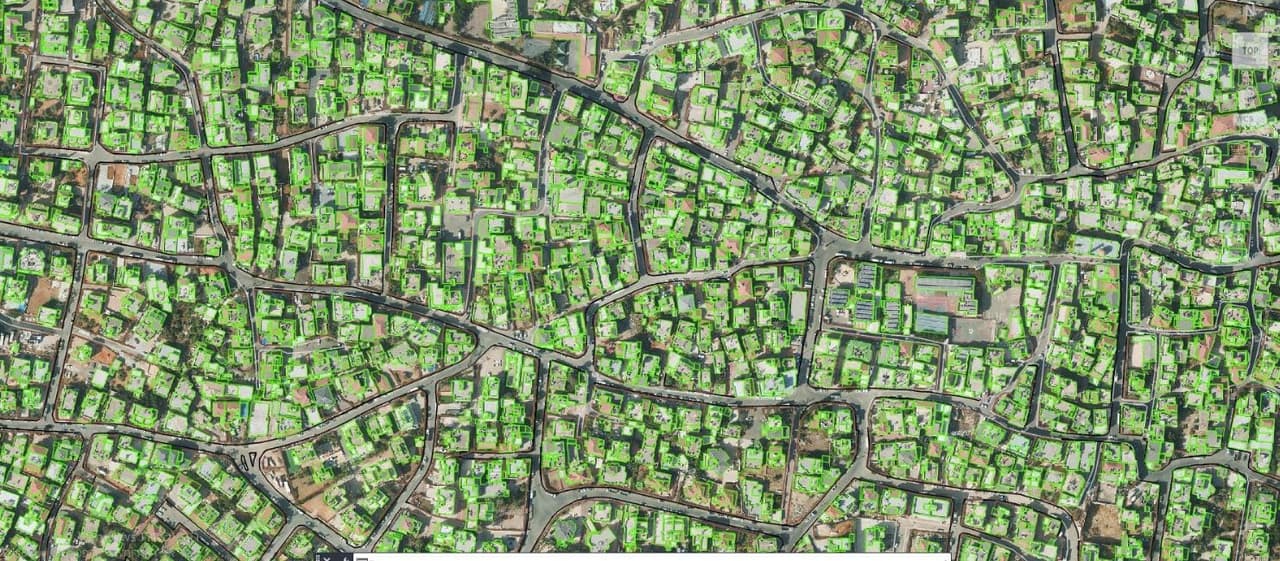
Outlines of mapped buildings in a neighbourhood -
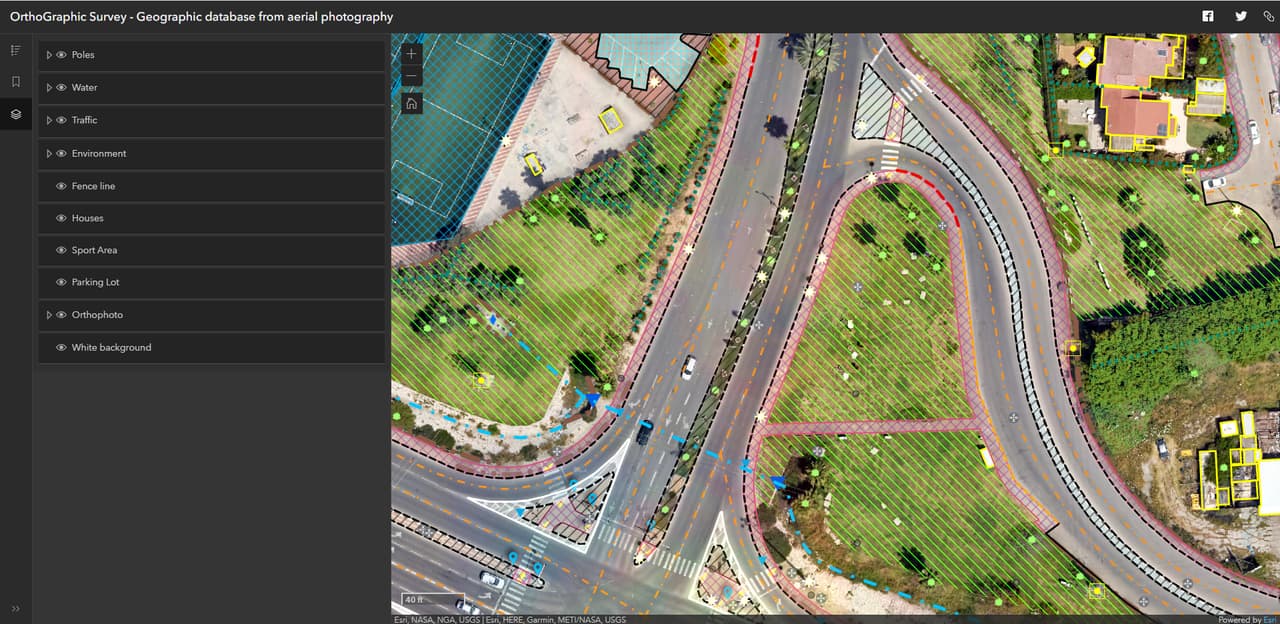
Dark map interface with a layer list
More projects
All projects-
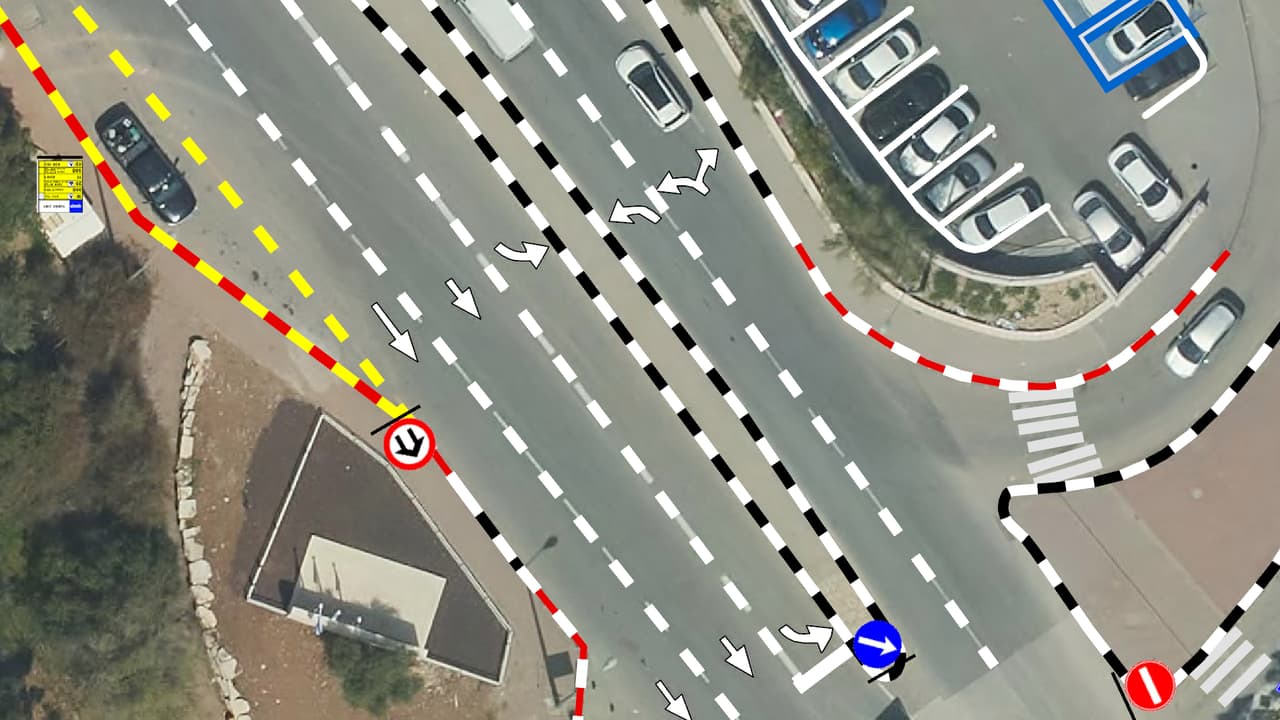
Vehicle survey of traffic signs and road markings
Camera vehicles with on-board AI, a person checking every frame, and every sign placed on the aerial photo: GIS layers of signs, poles and road markings, plus a transport app in ArcGIS Online. -
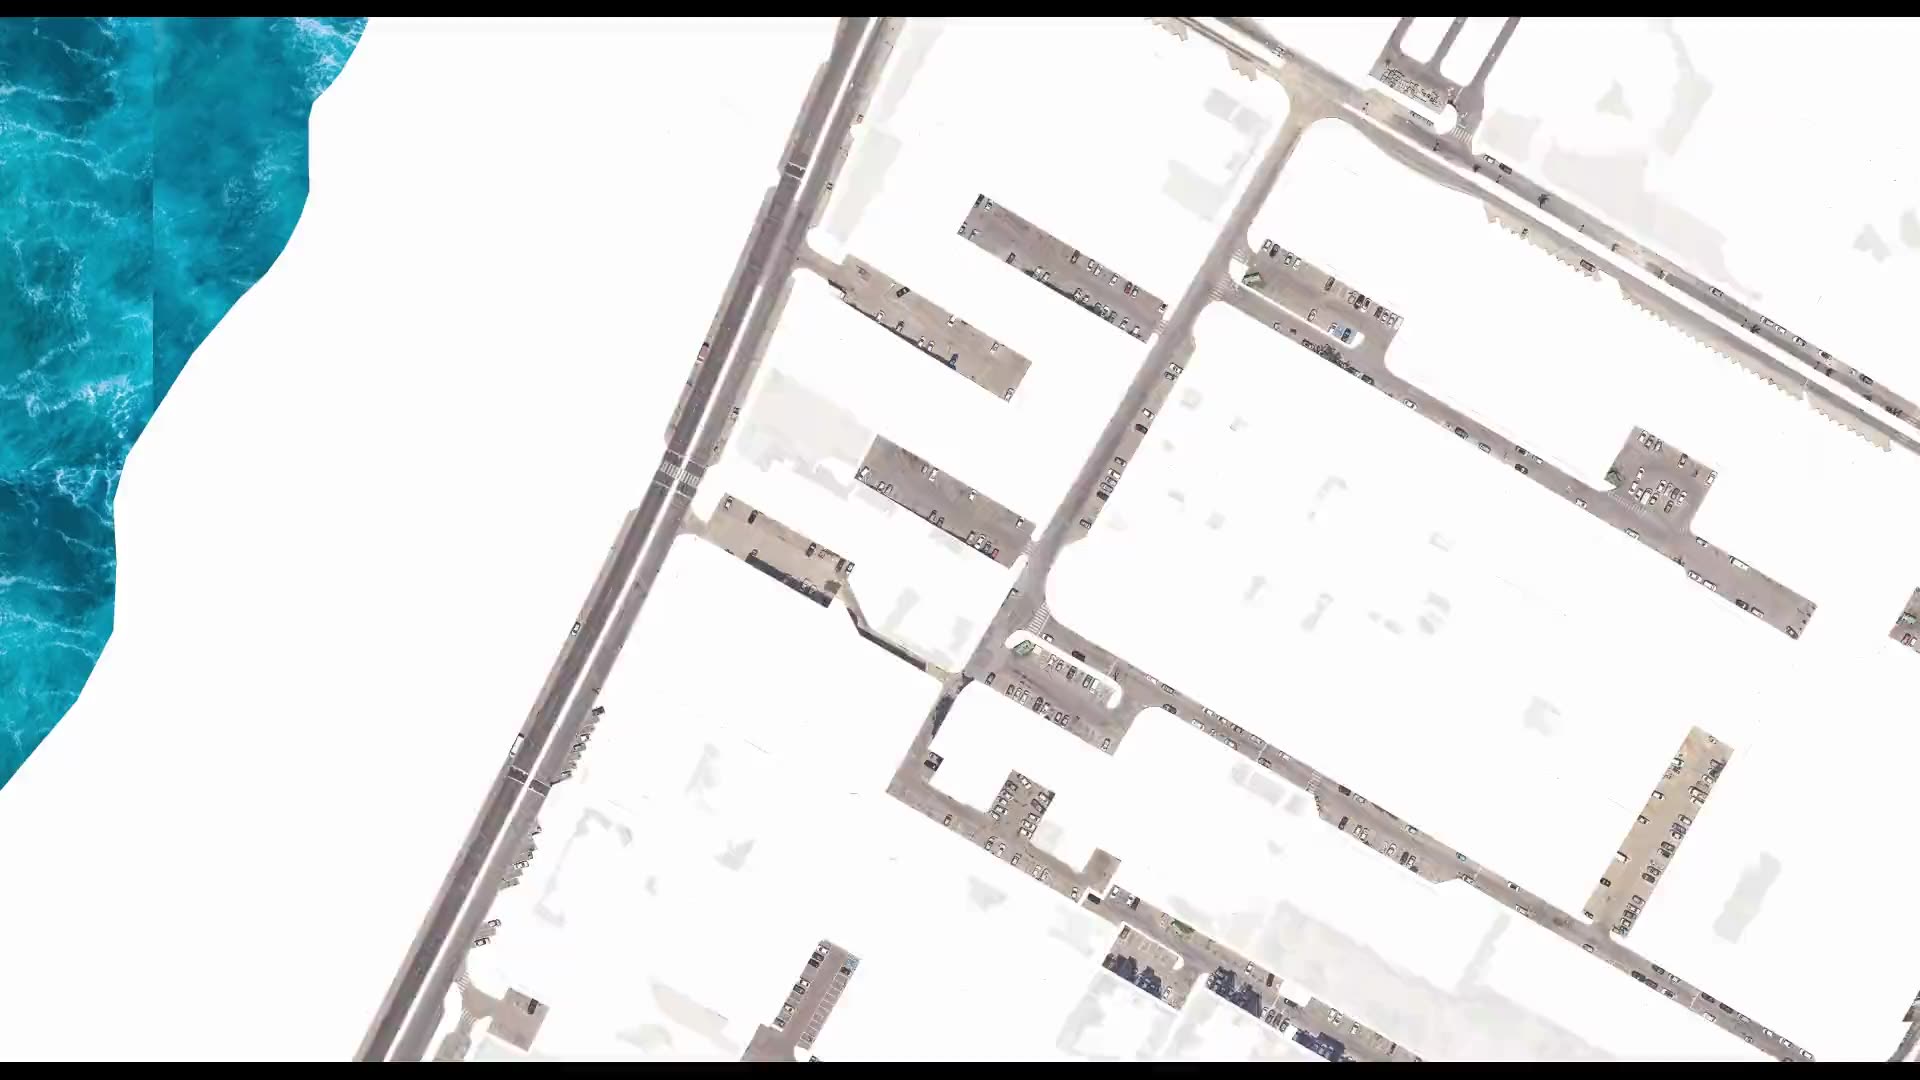
Street-level urban heat-island map – Kiryat Yam
Heat factors coded from the aerial photo, shade computed every half hour, and all of it combined into one shading priority map at the level of streets, paths and bus stops. -
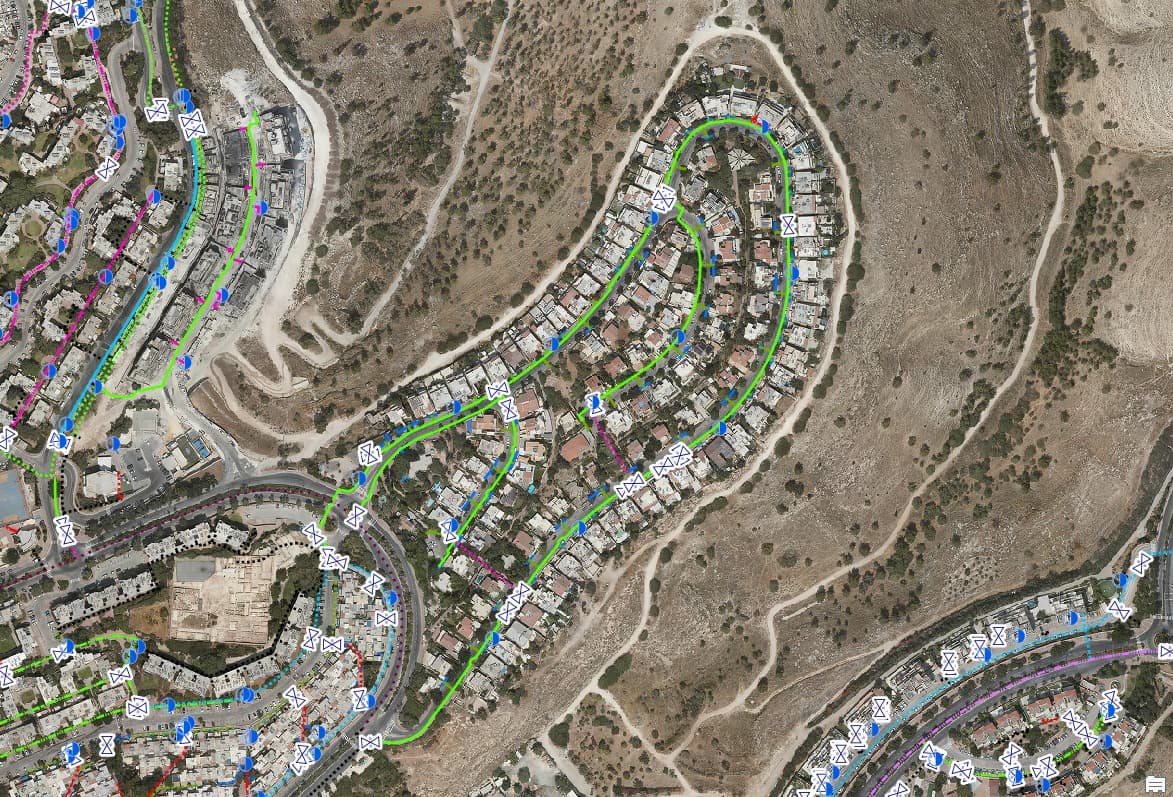
Drainage surveys: inlets, manholes and lines on the map
Urban drainage infrastructure mapped on the aerial photo for two authorities: inlets, manholes, drainage lines and inlet lines, with a city-wide survey map and a dashboard.
Your next project
What do you want to move forward in your organisation?
Tell us what needs solving and we will come back with a proposed approach: a survey, a system, software, or a combination.